Posts

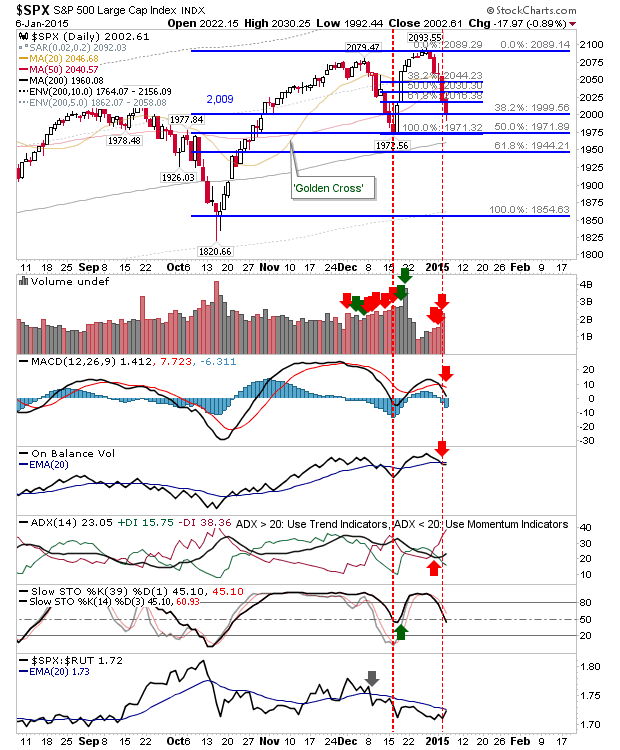
S&P Rallies Past 38% retracement

Image
Well, I got this one wrong. I didn't think the S&P had the juice to put in the day that it did, although volume was perhaps a little disappointing. Volume did enough to register an accumulation day, although buying volume was well down on previous selling volume. In terms of technicals, only On-Balance-Volume generated a 'buy' trigger. All other technicals remain bearish. However, I still don't like this rally, but it must be respected (for now). Because of degree of comeback, a move to 2,087 is favoured, but given the retest of 1,971 failed after the New Year decline, then a test of 2,087 has a high chance of failing too. Most likely long term outcome is a trading range between 2,087 and 1,971.

Unconvincing Recovery

Image
A gap higher at the start of business didn't lead to any big gains, but it did manage to put some distance on yesterday's lows. Given the risk:reward potential it's probably not a great 'buy' here, but if a higher low can be posted it will give bulls something to work with. A gap higher tomorrow could allow buyers set a stop on a loss of today's lows.

S&P Experienced Overselling

Image
Those looking for a pullback from the December-January rally in the S&P are now looking at a Fib overshoot. The loss of the 61.8% level typically means a retracement of the entire move, which in this case is a test of 1,971.32. If this does indeed happen it will set up a possible head-and-shoulder reversal, involving a rally back to 2,079 and then a move back to 1,971 - and below.  However, first step is to see a test of 1,971.

Back in the Saddle for 2015

Image
Another year rolls in as the secular bull market continues its march. We have seen some modest selling, although there has been little in the way of volume to back it up.  The S&P is sitting on its 20-day MA having closed Friday on an indecisive 'spinning top' doji.

Have a Great Christmas and New Year! Small Caps - It's Over To You....

Image
I will be keeping posts to a minimum until the New Year. Friday finished with a bit of a high volume flourish, which added a nice gloss to Thursday's big gains. The Russell 2000 managed to go one step further with a breakout. Watch this index over the coming days; if it can hold the move it will bring other indices with it. The Russell 2000 has under-performed (relatively) all year, and if bulls are to maintain a broader market rally into a sixth year then the Russell 2000 will have to do most of the leg work. As an important side note, the Russell 2000 turned net bullish technically. The flip-side is to watch for a 'bull trap', but even here, this might instead widen the recent trading range handle as major resistance lives at 1,210/15 not at 1,190.

Relief Bounce in Markets

Image
Those who took advantage of markets at Fib levels were rewarded.  However, this looked more a 'dead cat' style bounce than a genuine bottom forming low.  This can of course change, and one thing I will want to see is narrow action near today's high. Volume was a little light, but with Christmas fast approaching I would expect this trend to continue. The S&P inched above 2,009, but I would like to see any subsequent weakness hold the 38.2% Fib level at 1,989.

Market Selling Intensifies

Image
It ended up a roller coaster ride with markets rallying, then suffering losses to return indices to their lows. Volume rose in confirmed distribution, and many indices now sit inside Fib retracement levels - a good place to launch a relief bounce. The S&P finished just a few points above the 50% Fib level, with the 200-day MA near the 61.8% zone - and a more probable place for a bounce.

Archive

Show more