Posts

Late Rally Maintains Breakout Support for a Second Day

Image
Today looked a lot more bearish on an intraday chart than it did on the daily chart. For example, the daily chart in the S&P closed with a bullish hammer, but as with any reversal candlestick, a 'bullish' candlestick is considered bullish when in an oversold market - and this is not an oversold market.  However, the rally did enough to maintain a close above 2,009.

Pause in Rally Maintains Friday's Gains

Image
Friday's breakouts were small, and vulnerable to selling and 'bull traps', but today's action stayed close to Friday's highs, keeping bulls happy. The S&P has breakout support at 2,009 to work with, but it's hard to see this holding when sellers do return. The S&P has Fib levels, of which the 61.8% level close to the 200-day MA would offer an ideal opportunity - but there are plenty of support levels to work with on its way there.

Indices Break to New Highs

Image
Another days' gain, another set of breakouts in the bank. The Dow took out the September 'bearish evening star' with Friday's close.  At some point, this rally will have to confirm one of these levels as support, but for now, a new support level has been created.

Nasdaq 100 Ready to Break?

Image
All of the indices are threatening a break to new highs, but the first to do so may be the Nasdaq 100.  The last three days have shaped a small handle, defended by the breakout gap for support, and lurking very close to the breakout threshold at 4,118. Technicals are net bullish although it's underperforming relative to the Russell 2000, which may delay money flow into the index.

Indices Pause at Resistance

Image
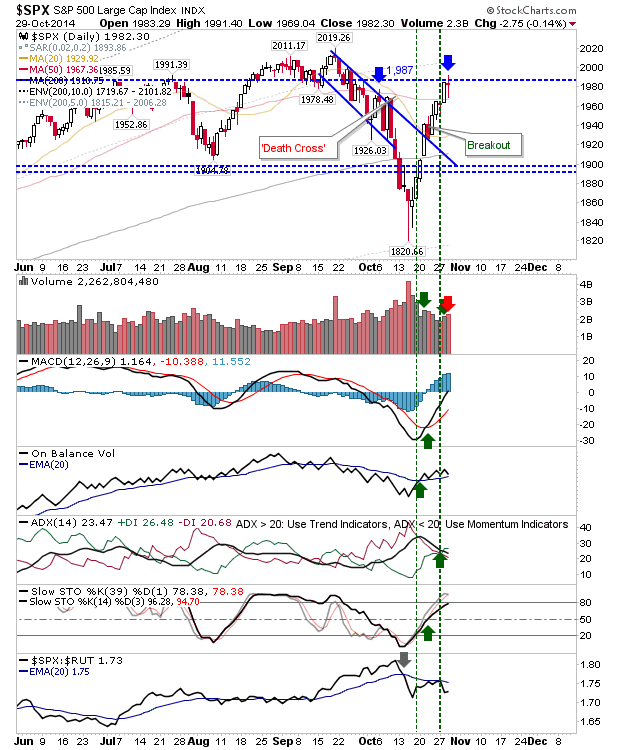
Yesterday's decent gain was followed with a consolidation today. The relatively wide intraday range finished with a flat close; a close which remained in the range of resistance. The S&P has a resistance level at 1,987 based on the July high with supply kicking in around September congestion.  This may evolve into a bearish head-and-shoulder reversal: for this to happen, look for a move back to 1,904 (August swing low) without a close above 1,987.  Technicals are bullish, along with the bullish trend in the 200-day MA, so a head-and-shoulder reversal would run against the technical picture. The Nasdaq is coming up against former support turned resistance, and may offer itself as a shorting opportunity. Meanwhile, the Russell 2000 is trading around its 200-day MA. Given the relative leadership of this index, and the fact other indices have breezed past their respective 200-day MAs, I wouldn't look for the Russell 2000 to linger here for too long as it continue

Daily Market Commentary: Powerful Rally

Image
An excellent day for bulls, particular for the Russell 2000. In the case of the latter index, the Small Caps Index broke declining resistance and 200-day MA in an almost a 3% gain. There was also an uptick in relative performance of the Russell 2000 against the Nasdaq and S&P.  This is well placed to continue into a test of the June high (with the September high next).

Pullback on Hold

Image
A rapid bounce, a one-day sell off which looked like something more, then a return to buying. There were important breakouts, but shorts are not out of the game yet. On the breakout front there was the S&P. Yesterday's selling didn't return below support and today put some distance on it. The 50-day MA may play as resistance tomorrow, but given it has flat-lined it may not play as big a role in this regard.

Archive

Show more