Posts

Daily Market Commentary: S&P Breakout?

Image
The S&P may have finally cleared resistance, although it was not a resounding breakout. The index edged above declining resistance, but remained below its 50-day MA. There was also a MACD trigger 'buy' to go with the gain. It's a possible long side trade with a stop below 1,601.

Daily Market Commentary: Second Rejection of Resistance in S&P

Image
As I write this, Futures are down, but yesterday saw a second rejection of both trendline resistance and the 50-day MA for the S&P.  Volume climbed to register a distribution day, although the volume was well off the selling of Monday.

Daily Market Commentary: Mixed Blessings

Image
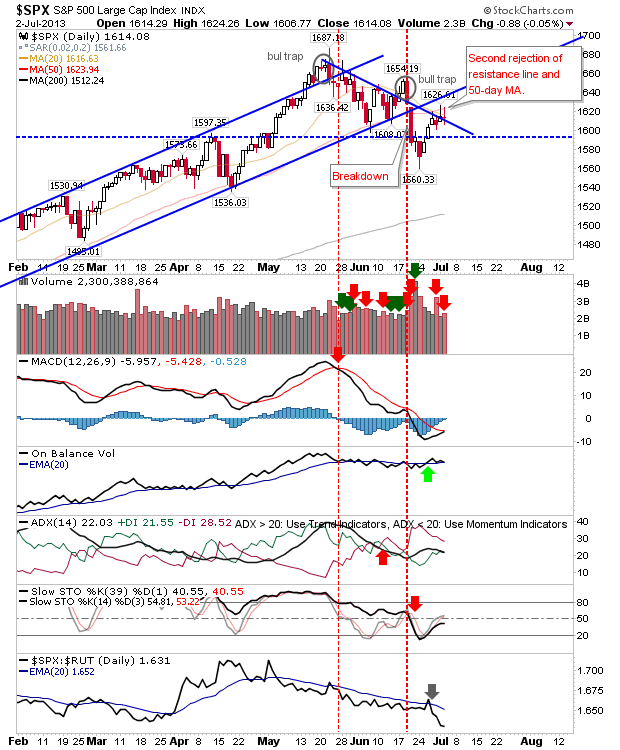
The day started by exceeding expectations. Shorts trying to fade the gap higher would have struggled, but those playing the afternoon drop may have walked away with a profit.  However, some indices finished above resistance (50-day MAs), making it a difficult play to predict for Tuesday. Today's weak finish suggests a mini-top for the 5-day rally is in place (stops on a break of today's high), with some indices offering short side opportunities. The S&P had the worst of the action. The index not only failed to hold the break above the 50-day MA, it also failed to hold its breakout. The inverse hammer offers a stop placement at today's high.

Weekly Market Commentary: Mix & Match Charts

Image
A strong week helped boost what was a torrid one before. However, it hasn't changed the larger picture of the decline from May's highs. The daily's continue to honor resistance (favouring shorts), with weeklies confirming this bearishness. But... breadth for the S&P has fallen enough to offer a long side play, although S&P Bullish Percents are still too rich for a major swing low. Nasdaq breadth metrics are attempting a swing low, but the Summation Index is suggesting "not yet".  Again, the latter is not in negative territory associated with a strong swing low.

Daily Market Commentary: 20-day MAs Tested

Image
A good day for indices saw sufficient strength for 20-day MAs to be tested. The Russell 2000 had the best of the action; it gained 1.7% to close the gap to its 20-day MA and bring the index to former declining resistance (since weakened by the 'bull trap').  However, there was a more significant relative strength change towards Small Caps and away from Large Caps and Technology - this is a more bullish development if the rally can advance past the June swing high.

Learning to Trade: Charting the MACD

Powered by InvestingTeacher.com All Contributions Welcome - Thank You! Follow Me on Twitter Dr. Declan Fallon is the Senior Market Technician and Community Director for Zignals.com . You can read what others are saying about Zignals on Investimonials.com . JOIN ZIGNALS TODAY - IT'S FREE!

Daily Market Commentary: On Course To Test 20-day MAs

Image
Markets continued their advance off Monday's swing lows, keeping things on course for a test of 20-day MAs (and for some, 50-day MAs).  One index has already tested its 20-day MA: the semiconductor index. It started the day just shy of its 20-day MA, but was unable to advance beyond it, closing just a few points lower. However, it is trading comfortably above its 50-day MA and channel support. How it fares tomorrow will govern how other indices react to it.

Archive

Show more