Posts

Stock Picks: $LLY, $BEAM, $CVS, $ORLY

Image
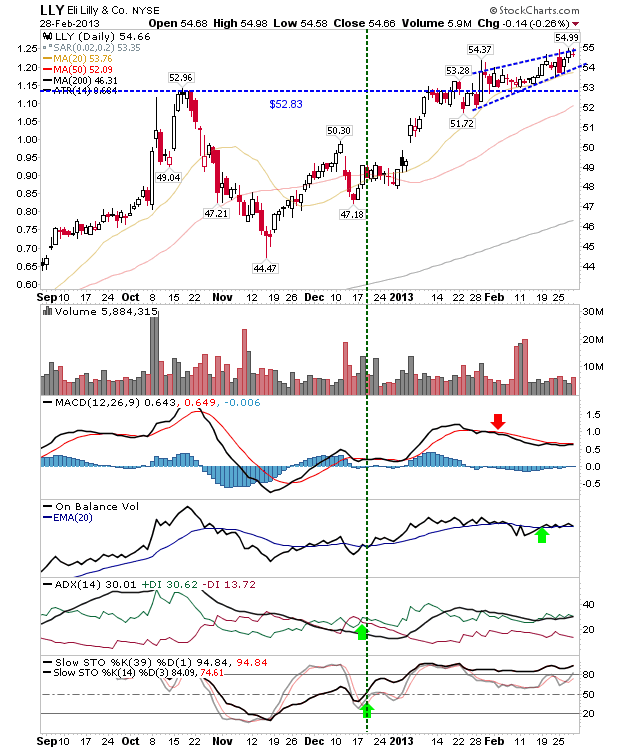
Four stocks featured in my latest Fool post here . The technical picture is provided below: Eli Lilly is held in my investment portfolio. The stock cleared $52.83 on modest volume and saw a pick up in volume as the stock made a confirmation test of $52.83. There is a narrowing rising wedge which - if fulfilled - will break downwards. A breakdown could evolve into a false breakout, but should this happen, look for a defense of the 50-day MA.

Daily Market Commentary: Another Day of Distribution

Image
While the rally flattens out, there is one side of the market which has sided with the bears, and that's the number of distribution days. The S&P has experienced five consecutive distribution days since the last accumulation day. However, On-Balance-Volume has maintained its accumulation trend, although it's under pressure from bears. Relative strength has shifted in favour of the S&P, which is bearish for the broader rally - although better news for the S&P.

Daily Market Commentary: Low Volume Recovery

Image
Big gains, but modest volume. The battle is on to decide whether yesterday's action marked a swing low, or if markets are in the process of shaping a top. Technicals and breadth indices suggest this is a top and the current bounce is nothing more than a relief move. But, a new all-time high will have to be respected, despite what technicals may otherwise suggest. But we are not there yet. The S&P didn't make it as far as its 50-day MA before bouncing.  The 'sell' in the ADX was reversed.

Daily Market Commentary: Well - That Didn't Last

Image
I was expecting a little more from bulls than a single days recovery, but it wasn't to be. Volume climbed to register a distribution day as shorts jumped on the push back towards 20-day MAs. After today's selling, 50-day MAs are now the next downward targets. The Nasdaq gapped over its 20-day MA, but finished just a few points above its 50-day MA. Tomorrow is a key day for the average; a loss of the 50-day MA means the 200-day MA at 3,009 is in play.

Stock Picks: $FN, $QIHU, $SHFL

Image
Fabrinet featured February 19th .  The stock enjoyed three days of strong buying in early February before consolidating at $16. It made a break of $16 in what should have been a continuation of the move, but the rally failed to materialize. A MACD trigger 'sell' has to be noted, but other techincals are firmly in the bullish camp. Remains a long play until there is a break of the 20-day MA and/or $15.51 - whichever is the lowest.

Weekly Market Commentary: Breadth Sell

Image
While Friday saw a low relief recovery which allowed some indices finish above their 20-day MAs, there was no such bounce in market breadth.  Indeed, Nasdaq Breadth Indices have confirmed a 'Sell' - led by the Percentage of Nasdaq Stocks Above the 50-day MA.

Daily Market Commentary: Selling Day 2

Image
In the end, 20-day MAs didn't prove to offer too much of a defense from sellers. Volume climbed in confirmed distribution as profit taking ruled the day's action. Next in line are 50-day MAs.  These should offer a more substantial defense. The move to selling has coincided with a relative shift away from speculative Small Caps to defensive Large Caps.

Archive

Show more