Posts

Daily Market Commentary: Rally Intact

Image
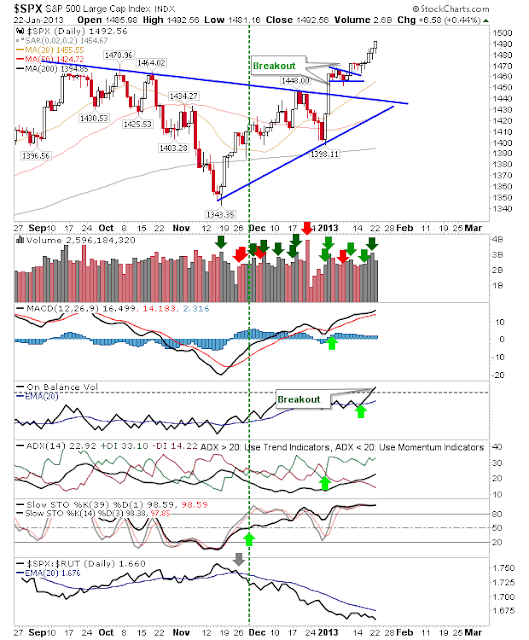
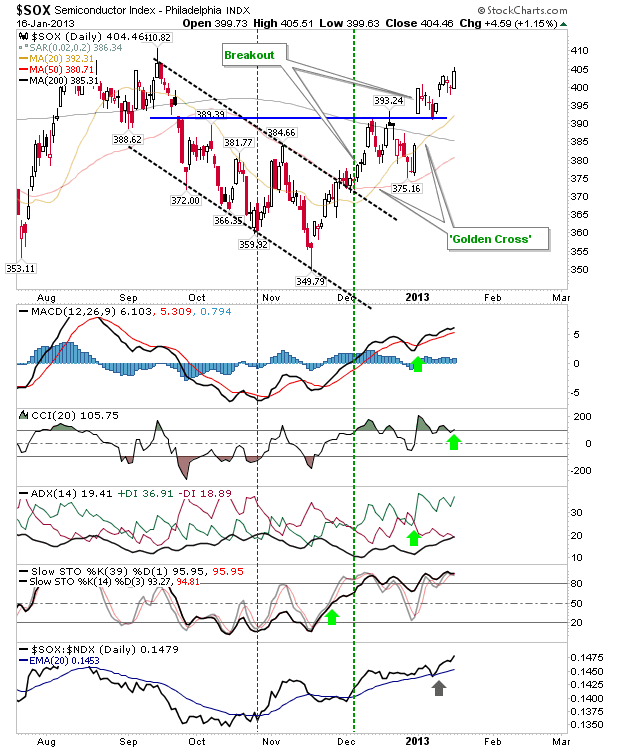
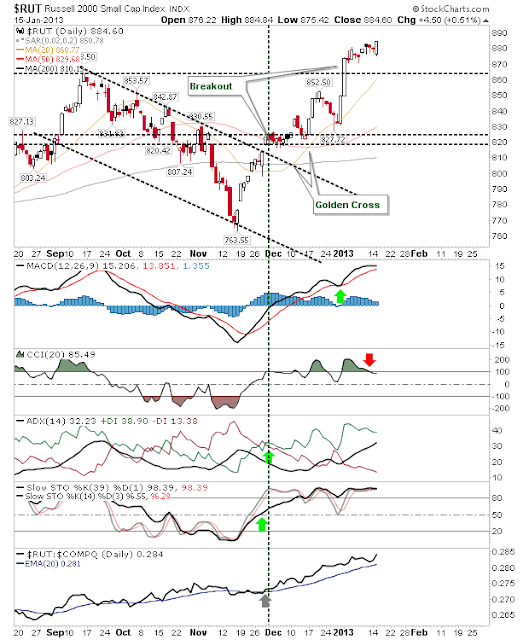
The long weekend didn't sate bulls appetite for shares and markets continued their advance higher, albeit on lower volume. Despite the lower volume, there was a resistance breakout for On-Balance-Volume in the S&P.  This should maintain support for the rally. The Nasdaq maintained its consolidation breakout, but it needs a solid gain to put some distance from the consolidation. The Russell 2000 has no such concerns. Today's gain maintained a run generated by the push above September's swing high. Technicals are running in overbought territory, with the index 10% above its 200-day MA. This is a good time for selling covered calls on existing holdings, with a reversion to mean likely to happen soon. In the short term, a cooling off period can be expected in the Russell 2000, but this might provide an opportunity for Tech and Large Cap indices to attract buyers and take up some of the running. --- Follow Me on Twitter Dr. Declan Fallon is the Seni

Weekly Market Commentary: Spike High in 52-Week Highs

Image
Last week, the NYSE 52-week high was approaching a spike high, but this week may actually mark the spike high.  The 19-week EMA at 419 is the highest it has been in 10-years.  The Nasdaq hasn't spiked to the same degree, but is approaching a yearly high.  However, spike highs in this indicator do not usually mark major tops, but are typically associated with the start of consolidations. The Percentage of Nasdaq stocks above the 50-day MA remains close to maxed out at 78%. Technicals are heavily overbought.  Again, as with 52-week Highs, swing highs in this breadth metric don't directly lead to a decline in the parent Nasdaq. Nasdaq Bullish Percents are inching their way towards resistance.  Technicals have only entered overbought territory, but stochastics usually remain overbought for a number of weeks before this breadth index peaks. It's a similar story for the Nasdaq Summation Index.  It's likely still a little early for a top in this breadth index.

Daily Market Commentary: Markets Breaks Higher

Image
The semiconductor index had the best of the day's action, climbing 2% and taking out the September high with ease. This move wasn't entirely followed by the Nasdaq and Nasdaq 100, although a minor breakout did materialize in the Nasdaq. The S&P cleared the tight consolidation from the past few days, but the extent of the reaction wasn't as great as I thought. The Russell 2000 kept its mini-follow through rally running, but again, nothing spectacular.  Bulls will be pleased too. I don't think bulls are done, with the semiconductor index likely to continue their good form.  The Nasdaq and Nasdaq 100 should benefit from its strong performance, although they haven't - yet - gone along for the ride. --- Follow Me on Twitter Dr. Declan Fallon is the Senior Market Technician and Community Director for Zignals.com . I offer a range of stock trading strategies for global markets which can be Previewed for Free with delayed trade signals. You c

Daily Market Commentary: Semiconductors Gain

Image
While recent action has focused on Small Caps, it has been the semiconductor index which has quietly advanced in recent days.  Today was a solid day for the semiconductor index, gaining over 1% as it fast approaches September's high.  The gain is also good news for the Nasdaq and Nasdaq 100, given how the rally in the Russell 2000 has stalled somewhat. For example, the Nasdaq 100 is holding on to its breakout gap.  The 20-day MA is also fast approaching and in a position to lend support. However, On-Balance-Volume is still trending lower in a path of distribution, but a few days of heavy volume buying could reverse this trend. The Nasdaq also has a consolidation to break from and a breakout gap to defend. Unlike the Nasdaq 100, it enjoyed a 'Golden Cross' between 200-day MA and 50-day MA, an important long term bullish trigger. The S&P spent another day preparing to break higher, but so far it hasn't done it, despite a higher volume accumulation day.

Daily Market Commentary: Divergence

Image
A very mixed day for the markets.  Bulls saw the best of the action in market leading Small Caps.  This just reinforced the relative gain between Small Caps and Technology indices. The S&P finished in the middle.  It was able to recover early losses and is nicely primed to push higher. On-Balance-Volume has effectively flat-lined, so the 'sell' trigger is less of a concern than it might otherwise be.  The 20-day MA is handy place for stops if going long (as is today's low for the more aggressive). The Nasdaq suffered enough of a loss to leave behind a 'bull trap'. It also added with a 'sell' trigger in On-Balance-Volume (which is trending down => bearish), not to mention a relative shift towards more bearish Large Cap stocks. It's not looking so good for bulls, although there was a key 'Golden Cross' between 50-day and 200-day MAs. Bulls have primed the market for further gains, but the Nasdaq has thrown a little doubt into

Daily Market Commentary: Repeat of Friday

Image
Apple had set a bearish tone at the open, but bulls were able to rally at the close to leave markets poised for further gains.  Not surprisingly, the Nasdaq posted a higher volume distribution day, but it didn't negate the flag breakout.  The index remains in good shape for bulls. While Apple may be weighing on the Nasdaq, it does have the help of a vastly improving semiconductor index. A break of September's swing high would help do the same for the Nasdaq. The Russell 2000 has experienced a series of narrow range inside days, which suggests a big swing move is about to follow. This should follow the prior trend and break higher. The S&P is also ready to clear its September high. Unlike the Nasdaq, there was no distribution in this index - another positive sign. For Tuesday, watch for upside follow through following last week's consolidation breakouts ---- Follow Me on Twitter Dr. Declan Fallon is the Senior Market Technician and Community

Weekly Market Commentary: Getting A Little Toasty

Image
In the short term, we are fast approaching a swing high for new 52-week highs in the NYSE and NASDAQ; the latter exchange to a lesser extent.  When this happens markets typically ease back, but this does not necessarily mark a major top (major tops tend to develop after a divergence in this breadth indicator, which is some way off here). The Nasdaq Percentage of Stocks above the 50-day MA is also heavily overbought, although this indicator can peak weeks in advance of the actual top in the Nasdaq. The Nasdaq Bullish Percents takes out the last swing high, but hasn't yet challenged declining resistance.  Technicals not overbought either (=> the Nasdaq rally still has room to run). Similar story for the Nasdaq Summation Index. Major swing highs typically occur when this breadth index cracks above 500, although a sub-zero high last summer did lead to big downdraft. However, action in this breadth index still favors bulls. The Nasdaq is on course to challenge 3,2

Archive

Show more