Posts

Daily Market Commentary: Finish Near Days' Lows

Image
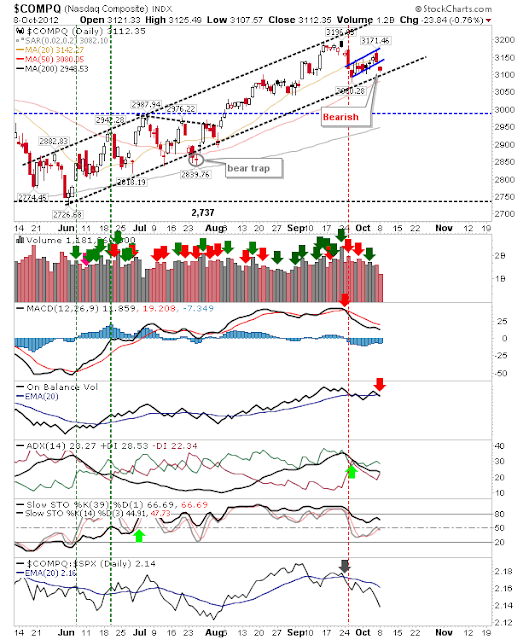
Bulls attempted a morning rush with strong opening gaps, but there was no expansion, and markets drifted lower to close at new lows. Large Caps were least impacted by the selling, going as far as to finish with a small gain.  A move to channel support will provide bulls with an angle for attack, look for this in the first hour of trading. The Nasdaq finished the day with a bearish engulfing pattern, although pattern significance is reduced in the absence of overbought conditions. Again, the 200-day MA is looking like a good downside target. The Russell 2000 offers the best long side opportunity.  The index managed a small gain on the day, but the 50-day MA and trendline support are close together, along with key horizontal support. Stops can go on a loss of 815. The Nasdaq 100 is also offering a support buy at the trendline, although the index is caught between its 50-day and 200-day MA. Will markets offer bulls something tomorrow? The Russell 2000 and the Nasdaq

Daily Market Commentary: Weakness Intesifies

Image
There was no last stand by bulls. Instead, further selling knocked more indices into net bearish territory. The semiconductor index was again the worst hit index.  The next point of support for the indices is the double bottom down at 350. There is very little in the way of alternative support to suggest it won't make all the way there. The Nasdaq lost further ground to its channel support, and was unable to regain 50-day MA support. Volume also climbed to register net distribution. The next support level is down at 3,000, likely 2 or 3 days away from a test. The Percentage of Nasdaq Stocks above the 50-day MA also turned net bearish technically. Soon, fewer than 50% of Nasdaq stocks will be above this key moving average. Small Caps were least impacted by the selling, digging in at 50-day MA support.  However, the lack of selling couldn't prevent a net bearish turn in technicals. It's still the index most likely to lead higher.  While it didn't play to

3 Stocks to Watch: $JAZZ, $ASBC, $HOGS

Image
This weeks' stock picks under review are Jazz Pharmaceuticals, Associated Banc-Corp and Zhongpin. The fundamental review on these stocks can be read here .

Daily Market Commentary: Semiconductors Struggling

Image
It was a bit of blitz on technology indices and semiconductors as sellers swept the day.  Large Caps escaped largely unscathed, although there was still enough damage to see a breakdown in the bear flag. The semiconductors are in the most trouble. Today's losses undercut the prior swing low.  With the index trading below all key moving averages (20-day, 50-day, and 200-day MA), it looks like things are going to get worse before they get better. The Nasdaq 100 sliced clean through its 50-day MA, and is looking at trendline support.  If this fails to hold it's the 200-day MA next.  Given action in the semiconductor index, it's looking more likely the index will drop to its 200-day MA.  The Nasdaq 100 was the first of the key indices to turn net bearish technically. There was also a break in the Nasdaq. The loss undercut the channel support line too, with next support its 200-day MA.  Unlike the Nasdaq 100, there was no net bearish turn in technicals - although it&

Daily Market Commentary: Breaks in Tech and Small Caps

Image
Columbus Day was a quiet day for the markets.  Trading volume was light. This lessened the impact of the observed breakdowns in technology indices. The gap down for the Nasdaq finished just above rising channel support.  Despite the light volume there was a bearish 'sell' trigger for on-balance-volume. It was the same for the Nasdaq 100, although the index finished close to horizontal support at 2,795. The Russell 2000 also broke from its bearish flag.  Interestingly, there was a relative swing in favour of Small Caps over Technolgy, despite the 'bear flag' breakdowns in each of the indices. Only Large Caps escaped the worst of the sell off as the index remained in the upper zone of their 'bear flags'. Will the return of traders from the bank holiday weekend see an expansion of the sell offs for the Nasdaq and Russell 2000? --- Follow Me on Twitter Dr. Declan Fallon is the Senior Market Technician and Community Director for Zignals.co

Weekly Market Commentary: Breadth Divergence?

Image
Market Breadth continued to evolve swing highs which indicate a slowing of the advance, if not an outright top.  Although, as the Percentage of Nasdaq Stocks Above the 50-day MA suggests, it often takes a lengthy bearish divergence in breadth swing highs before the parent index puts in an actual top. In this regard, we are still in the early stages of shaping this divergence. The Nasdaq Bullish Percent Index has slowed just below declining resistance defined by 2010/11 swing highs.  Slow stochastics have fallen short of overbought conditions (bullish), although the MACD histogram suggests a peak is already in place. The Summation Index has also started its rollover process from its swing high and tends to be more consistent in its trend direction, particularly off extremes.  In this case, further lows can be expected in the Summation Index Index and likely the Nasdaq too. With breadth likely further weakness, it's questionable whether 3,100 support will hold. Th

Splunk's ($SPLK) Big Data Big Profits

Image
My Motley Fool post on Splunk (SPLK) is available here . A full list of my Motley Fool posts is available here . Follow Me on Twitter

Archive

Show more