Posts

Weekly Market Commentary: Losses Haven't Broken Trend Yet...

Image
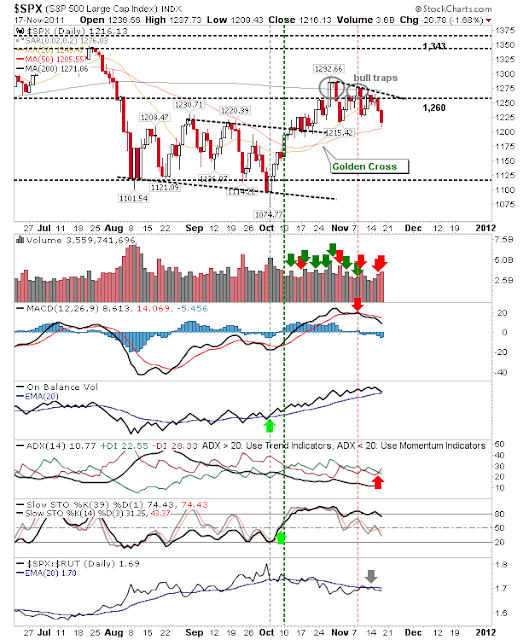
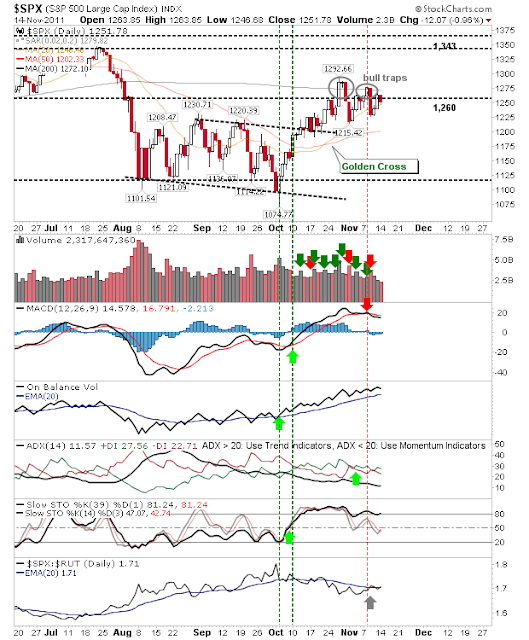
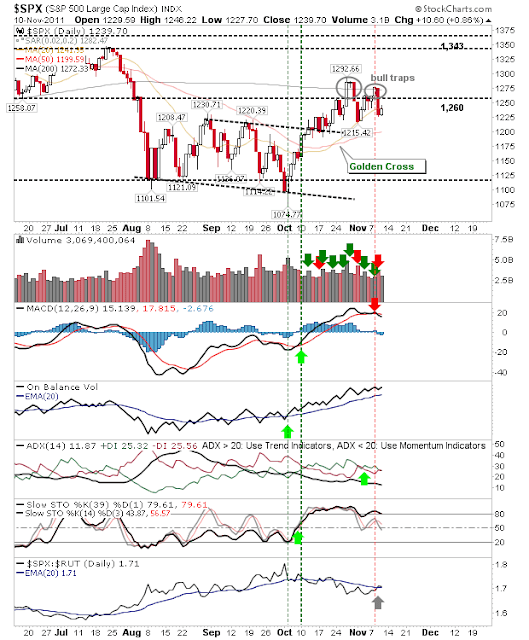
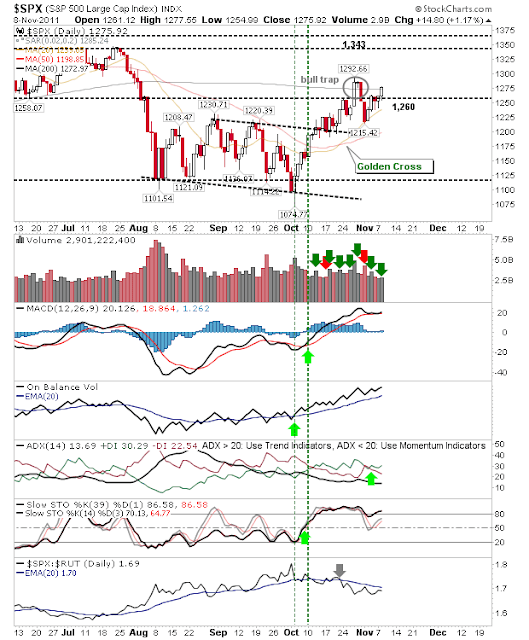
Last week's damage on the daily time frame didn't change too much on the weekly one. The Dow was the only index to show a change on the week; losses left a new 'bull trap'. Stochastics didn't make it to overbought levels prior to the 'bull trap' developing.  Optimists will see this as offering room for further gains. Pessimists will see this as the start of a bear market top. The 'bull trap' in the Dow was not repeated in the S&P. Support at 1,209 remains in play and bulls have a good opportunity to mount a defense next week. The Russell 2000 confirmed resistance at 760 but the weekly loss didn't take it below rising channel support. The shortened week and the traditional 'Black Friday' rally will likely see such support hold for another week. Just to complete the set, the Nasdaq finished on channel support. Will bulls be able to take advantage? Monday will be a good place to start. ------ Follow Me on Twitter

Daily Market Commentary: Bears Add Misery

Image
The initial slash cut was made Wednesday, but bulls were unable to stem the bleeding as further losses mounted today. Volume climbed to bring a second distribution day in a row; the last time this occurred was in September (and was followed by a 3-day rally). The main damage done today was the push to the low end (or out-of) sideways consolidations in play.  Bulls still have support to work with, which in many cases are 50-day MAs - but they are running out of options to prevent a retest of October lows. The S&P was one of the indices to finish on its 50-day MA. Technical weakness was marked by the bear cross between +DI/-DI, although ADX does not (yet) suggest a bear trend is beginning. The main damage done today was to the Nasdaq 100. An ugly break of 2,320 support on an over 2% loss also saw breaks of the 200-day and 50-day MAs. Thursday's selling even saw a close below the October swing low. To add to the misery, on-balance-volume switched to a 'sell' trigger

Daily Market Commentary: Selling Pressure

Image
Sellers made their first show in over a week as volume climbed. Worst effected were Large Caps, but no index escaped their influence. The S&P cracked below its 20-day MA as 1,260 played as resistance (and the marker line for the two 'bull traps'. The MACD has been on a 'sell' signal since early November, but other technicals are still okay. The Nasdaq is contained by the 200-day MA. Yesterday's gain to this moving average was rebuffed and ended today with a loss of the 20-day MA. However, 2,616 support was retained. Like for the S&P there was an earlier loss in the MACD which was followed by a bear cross between +DI and -DI. The ADX is non-directional - reflecting the sideways trading the index has experienced since early October. The Russell 2000 held up a little better today despite exhibiting greater technical weakness. The index is below its 20-day MA (just) but is only a couple of points away from 731 support.  However, if weakness is not to

Daily Market Commentary: Support Holds

Image
There were modest, low volume losses in the market, but the bulk of Friday's gain was retained. The S&P held its 20-day MA and dipped below 1,260 - but probably is close to enough to still be considered at support. In the meantime, the S&P 'bull traps' are still in play. The Nasdaq spent another day below its 200-day MA after Friday's close finished just below the moving average. The index remains well above 2,616 support. Meanwhile the Russell 2000 closed on converged 20-day MA and 731 support. This may yet evolve into a third 'bull trap', but for now its trading at support. While today's losses didn't knock out support a fresh loss tomorrow certainly will. Bulls will need to get up early to keep markets at these levels otherwise a push down to 50-day MAs will be on the cards.  Watch Futures for leads. ----- Follow Me on Twitter Dr. Declan Fallon is the Senior Market Technician and Community Director for Zignals.com . I

Weekly Market Commentary: Little Change

Image
There was little change in the weekly picture as Large Caps continued to put their best foot forward, while Small Caps and Tech indices remained pegged by their respective 'bear flags' The Russell 2000 spent another week stuck under 760 and kept a potential of a bearish head-and-shoulder pattern in play. For this to be true, 760 can't be breached and a decline back to the 593 neckline should happen soon, preferably starting next week. Large Caps enjoyed the best of the weeks action. Two weeks ago they emerged from the 'bear flags' influencing other indices and last week were able to recover the losses of the previous week. Technicals are not overbought - but rising - suggesting there is more upside to follow. Helping the S&P was the break of long standing declining resistance (from 2009) in the NYSE Summation Index.  This well help fuel the Large Cap rally. The Nasdaq closed the week on a 'spinning top', reflecting indecision. The &#

Daily Market Commentary: Technicals Weaken

Image
The real damage was done yesterday (in my absence!), but the weakness triggered by the selling was not relieved by today's weak buying; today's volume was sharply down on yesterday's selling. Technical deterioration, led mostly by MACD trigger 'sells', added to indices troubles. The S&P posted the second of two 'bull traps' as the index struggled in its second challenge of its 200-day MA. On the plus front, the index started to outperform the Russell 2000 (Small Caps). While this is good news for the S&P it's not good for the long term prospects of this rally. A sustainable rally needs money flow to speculative Small Cap stocks - not defensive Large Cap issues. The Nasdaq was similarly afflicted with a MACD trigger 'sell' and a 'sell' in the Directional Movement index. On the plus front, Thursday's close held 2,616 support which has been support since early October. While indices are wavering in their technical health,

Daily Market Commentary: Higher Volume Accumulation

Image
Another good day for the indices leaves things a little uncertain for tomorrow. The last swing highs are fast approaching but these will add supply on further gains. The S&P closed above its 200-day MA, maintaining 1,260 support. The Nasdaq edged over its 200-day MA and is only a day away from testing the October swing high at 2,753. The Russell 2000 defended 731 support. Meanwhile, the 'bull trap' which played on the initial break of 731 is under threat of negation. Tomorrow is a little trickier to play. The highs of 'bull traps' are the next challenge but whether there is the demand to see this happen tomorrow remains to be seen. The good news is bulls are in firm control of the market. ------- Follow Me on Twitter Dr. Declan Fallon is the Senior Market Technician and Community Director for Zignals.com . I offer a range of stock trading strategies for global markets which can be Previewed for Free with delayed trade signals. You can al

Archive

Show more