Posts

Daily Market Commentary: Accumulation or Churning

Image
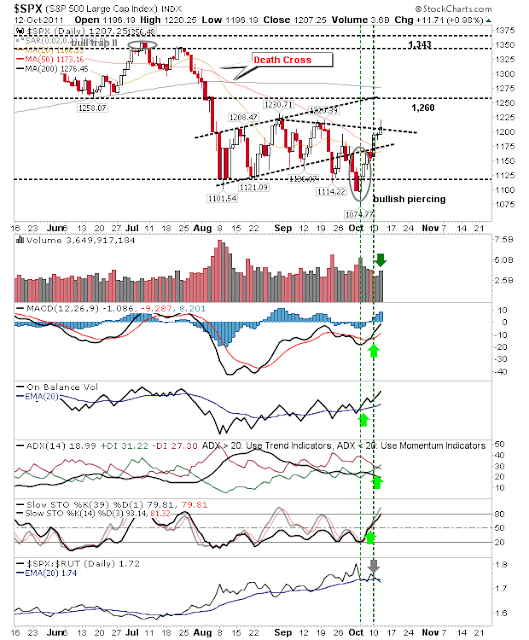
Bulls went to town and added another day of gains to this October rally. However, bulls were unable to push on from opening gaps. Volume climbed which may either rank as accumulation (because of higher prices) or churning (because markets closed at or below their opening levels). The S&P had managed to clear declining resistance in early trading but sellers returned to bring it back below resistance. Technicals remain net bullish while relative strength shifted back to the Russell 2000. The Nasdaq posted a 'shooting star' doji just below 2,616 resistance. This is likely to be a point where sellers take over for the next couple of days. The Russell 2000 pushed above its 50-day MA but technicals haven't done enough to turn net bullish (yet). However, Small Caps have taken a leadership role over Tech (and Large Caps). The index is back inside the quagmire of the prior consolidation so it's likely to get scrappy from here. The 200-day MA is the logical upsid

Daily Market Commentary: Tight Trading

Image
It was a quiet day in point terms but taking a peak under the lid revealed a far more bullish day. The first point of note was how indices were able to hold all of yesterday's gain and even add a little (for the Nasdaq 100, Nasdaq and Russell 2000). The quietest indices were Large Caps. The S&P barely added a point, but technicals continued to advance higher - there is still plenty of room for these to gain. ($SPX) via StockCharts.com The Nasdaq finished the day net bullish with a slight uptick in volume (net accumulation?). The index remains on course to test 2,616 resistance. ($COMPQ) via StockCharts.com Strength in the Nasdaq was reflected in the Bullish Percents. Here technicals of the breadth indicator are net bullish with powerful bullish divergences in the CCI and MACD. ($BPCOMPQ) via StockCharts.com The Nasdaq 100 got as far as its 200-day MA as technicals rolled net positive. This index remains the one most likely to challenge July highs. ($NDX)

Daily Market Commentary: Dow Net Bullish

Image
Despite it been Columbus day and the light trading volume to go with it bulls enjoyed a good day in a series of good days. Best of the indices was the Dow Jones. Technicals improved to the extent it's now net bullish. There may be evidence for a break from a newly formed channel, but it will need volume (on an up day) to confirm. The rally cleared both 20-day and 50-day MAs with the 200-day MA the next upside target. The S&P didn't quite share the glory of the Dow Jones but had a good day. It hasn't edged itself past its consolidation, but it did enjoy a MACD trigger 'buy' and a Stochastic 'buy' with a close above both 50-day and 20-day MAs. Relative strength swung back in its favour over more speculative Small Caps. The Nasdaq cleared sharply declining resistance defined from early September on the back of a MACD trigger 'buy' and Stochastic 'buy'. Resistance at 2,616 is the next challenge. While the Percentage of Nasdaq

Weekly Market Commentary: Market Breadth Improves

Image
Indices gave up a little ground on Friday's close after a solid week of progress. Bulls have much to be pleased with although 20-day and/or 50-day MAs remain a challenge on daily timeframes. On the weekly timeframe market breadth continues to feel around for a bottom. The Percentage of Nasdaq Stocks Above the 50-day MA generated a 'buy' trigger as it increased 9 percentage points to 25%. Likewise, the Nasdaq Bullish Percents also sits at 25% as it works support around 24%, although it's someway from seeing a technical 'buy'.  While the Nasdaq Summation Index is just shy of a technical 'buy' signal. The Nasdaq rally on the weekly timeframe hasn't yet reversed the 'bear flag' breakdown - although it would only take a minor gain this week to put the index back inside the 'bear flag' and possibly create a new 'bear trap' (on the weekly timeframe). S&P Market Breadth is a little better than it is for

Daily Market Commentary: Third Day of Gains

Image
The momentum built up over the last couple of days extended into a third. Volume continued to drop off and the issue of resistance at moving averages is now a concern. How far have bears been driven? Soon we will find out. The S&P is at its 20-day MA, but it's also at former channel support turned resistance. It would be a big ask to see it make a fourth day of higher prices in a row. ($SPX) via StockCharts.com The Nasdaq is left in a similar position to the S&P with channel resistance and moving averages in play. The only difference is the convergence between 20-day and 50-day MAs which makes it more probable sellers will make an appearance (along with shorts) before they do elsewhere. ($COMPQ) via StockCharts.com An area which may help bulls is the improving breadth (and technical support) in the Nasdaq Bullish Percents. If the Nasdaq could push above 35% of stocks on point-n-figure 'buy' signals it would really send it to the races. ($BPCOMPQ) vi

Daily Market Commentary: Low Volume Gain

Image
After strong gains yesterday it was surprising to see some decent follow through even if volume was a little light. The buying may have had more in common with short covering, but there aren't many supply issues blocking the advance until indices reach 20-day and 50-day MAs. The S&P sits just 20 points away from a test of its 20-day MA. With the bullish piercing pattern there was an on-balance-volume 'buy' trigger.  Relative strength continues its swing towards more speculative Small Caps, a bullish development. The Nasdaq added just over 2% as it scraped an on-balance-volume 'buy' trigger. Tech indices also enjoyed a bullish swing in relative strength over Large Caps (another tick in the bullish column). Driving support for the rally in the Nasdaq is the 3%+ gain in the semiconductor index. It's also the index most likely to challenge (and break?) its 50-day MA. If this was to happen it would be critical leading action for other indices - the Na

Daily Market Commentary: Bullish Reversal Patterns

Image
Today's market was like an Irish summer's day - when all four seasons appear in the one day. The day started with a small gap down. This was followed by further losses before rebounding back to yesterday's close. Then markets took a second spin lower, before a late day surge took indices into (or above) yesterday's candlesticks. The Russell 2000 demonstrated this recovery the best. While technically it remains weak and hasn't negated yesterday's breakdown, it was able to rally over 6% and see a shift in relative strength from Tech to Small Caps - a bullish development. Any upside tomorrow would put down a new marker for a 'bear trap'. Next on the list is the Nasdaq. While it lost ground relative to the Russell 2000 it did have more success in creating a new 'bear trap'. Today's huge volume buying comfortably regained support and sets up a potential challenge of the 20-day / 50-day MAs up at 2,512. Bulls may have something to smile abou

Archive

Show more