Posts

Stock Market Commentary

Image
The Nasdaq, Nasdaq 100 and Russell 2000 all gave up their 20-day and 50-day MAs, handing large caps the leadership role following their moving average breaks on Friday. Tech averages also lost rising support from November lows. Large caps saw increased weakness with technical 'sells' in MACD, On-Balance-Volume and the ADX. The building weakness has turned into something more than just a pullback of an advance, but instead looks like a developing retest of November lows. Short term technicals are oversold, so if the next bounce stalls out at the 20-day/50-day MAs then the retest is confirmed. Dr. Declan Fallon, Senior Market Technician, Zignals.com the free stock alerts, market alerts and stock charts website

Weekly Stock Charts review

Image
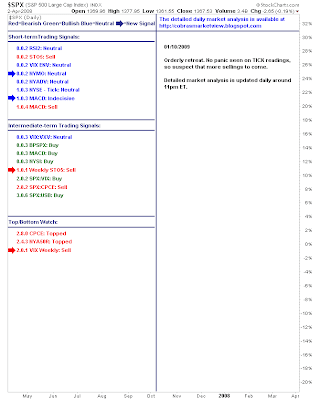
The first full week of trading under the belt. How did it rate? Yong Pan sees more neutral rather than outright negative action for the breadth indicators, but expects selling to continue - note the new Top/Bottom Watch: S&P top? But SPY shows support at 20-day MA. I don't consider the bearish engulfing call strong because the market is not overbought: Almost a MACD 'buy' on the S&P weekly? Interesting view on the 30-minute SPY: Maurice Walker talks "stimulus bubble" - click through for the full spiel: Since the late 1990s the US has gone from a Tech Bubble, to a housing bubble, to commodities bubble. Next we will have a treasury bubble and then finally a stimulus bubble. But with the actions that the federal reserve is taking right now, we are setting up for the next two bubbles. The treasury bubble and the stimulus bubble! First of all, let me say that I'm sure that President Bush and Barack Obama are fine men. Ironically, they both have similar a

Stock Market Commentary

Image
A more substantial loss on percentage terms but a bit of a mixed bag technically. The tech averages escaped the worst of it as the Nasdaq and Nasdaq 100 finished above their 20-day and 50-day MAs; ascending triangle breakouts have failed but rising support of those triangles have not - so it's not all bearish Large caps weren't so lucky as 20-day/50-day MAs were breached along with rising support. Technicals weakening but not all in the red. Initial project is for a run to early December lows. Small caps have held their breakout and in the process of making a support backtest along with a test of the 20-day MA. Normally small caps lead markets; given the Russell 2000 is successfully holding support assume for now that the breaks of support in the large caps are bear traps. Dr. Declan Fallon, Senior Market Technician, Zignals.com the free stock alerts, market alerts and stock charts website

This one is for all the Ladies out there....

From the folks of AlphaKing . Buy this file: 2255299 Enjoy! Dr. Declan Fallon, Senior Market Technician, Zignals.com the free stock alerts, market alerts and stock charts website

Stock Market Commentary

Image
Wednesday's selling didn't morph into something worse and it was good to see buyers step in before indices made it back to their respective 20-day/50-day MAs. This is not to say indices won't get there but there is reason to expect these moving averages to hold as support. The Dow was interesting as it held rising support connecting November and December reaction lows And was one index to actually make a positive test of its 50-day MA. Also note the likelihood of a head-and-shoulder reversal pattern: Little else to add until the Jobs Report hits the tape. Dr. Declan Fallon, Senior Market Technician, Zignals.com the free stock alerts, market alerts and stock charts website

Nasdaq stalls as it seeks support

Image
The Nasdaq ran into and reversed from a declining resistance line created by the reaction peaks in August and September; previous resistance lines from September-October and September-November have been breached so this looks to be another step towards a continuation of the "Santa Rally". Yesterday's wedge breakout cut back below the resistance line and is now looking at the 20-day/50-day MAs for support (on a closing basis) The picture in the S&P is similar; again, note the disparity in peaks between the Percentage of Stocks above their 50-day and 200-day MAs for May and January - how will this map out with respect to the market? My expectations are for markets to find support (by closing prices) at the 50-day MAs. Rally is mature for a bear market but it's not dead yet. Dr. Declan Fallon, Senior Market Technician, Zignals.com the free stock alerts, market alerts and stock charts website

Stock Market Commentary

Image
The next downleg begins. Overall, the large point loss in the indices was offset by the lighter volume. It will be important converged 20-day and 50-day MAs hold as support if the Santa rally is to continue - any decisive break on volume would likely coincide with a counter-break of the ascending triangles which have played out quite well (so far). One thing that will have bulls worried is the VIX rally just shy from its 200-day moving average support; there could be more to this decline than a simple support test. However, the double top neckline will be the first resistance test for the VIX. Look to the break of the bearish divergence in the RSI as the first sign of a rally in the VIX. Dr. Declan Fallon, Senior Market Technician, Zignals.com the free stock alerts, market alerts and stock charts website

Archive

Show more