Posts

Nasdaq wedge breakout

Image
On a closing basis the Nasdaq has managed to crack through resistance, but has done so on a background of falling money flow and overbought momentum. The developing bearish divergence in money flow isn't helping The good news is the freed room to 2,100 and/or 200-day MA, assuming it can hold above former resistance (now support) as marked by the broadening wedge. I haven't seen the TICK this consistently bullish in a while; no real overbought condition either which is unusual considering other breadth indicators A downward move looks likely today based on futures, so it will be matter of where support will kick in, and from that, what we are lookng at from the broader picture Dr. Declan Fallon, Senior Market Technician, Zignals.com the free stock alerts, market alerts and stock charts website

Stock Market Commentary

Image
Markets shrugged off overbought conditions to post gains on higher volume. The day registered as an accumulation day for all key indices. One watch area is declining resistance for the Nasdaq 100 dating back to late summer; a break will set a precedent for the other indices to follows Biggest winner on the day was the semiconductor index with a 5% gain. It too is approaching late summer declining resistance with room to challenge the 200-day MA should it break - again, this would provide a boost for the other indices. So which resistance level will come into play? Dr. Declan Fallon, Senior Market Technician, Zignals.com the free stock alerts, market alerts and stock charts website
Breadth indicators getting toasty

Image
It hasn't taken long for stocks to push above their much weakened 50-day MAs, but the 200-day MAs are still a long way from been challenged. The Nasdaq is overbought for the current cyclical bear market with respect to the Percentage of Stocks above their 50-day MAs and Percentage of Stocks on Point-n-Figure Buy Signals. But the Summation Index has upside room, and the 'dead mans' zone between the 50-day and 200-day MAs will provide wiggle room for stock gains without further overheating of breadth What has been disappointing is the underlying strength marked by improving breadth hasn't translated to points gains for the Nasdaq. I think we will see a gradual decline in the Percentage of Stocks trading above their 50-day MAs as overbought levels are relieved - but this will be compensated by a growth in stocks trading above their 200-day MAs as new market leadership emerges. The Bullish Percents will return to pre-2007 support/resistance boundaries and the 42.5% resistan

Stock Market Commentary

Image
A day when bulls could breathe a certain sigh of relief as last week's low volume gains held in all markets. Volume did rise to register a 'distribution' day but the lack of range to intraday trading suggests no real selling at work. Best thing about the indices (which triggered Friday) was the net bullish turn in momentum, trend and volume indicators; this strength held through Monday. Small caps continued to lead as declining resistance, 50-day and 20-day MAs remain decisively breached: So far so good... Dr. Declan Fallon, Senior Market Technician, Zignals.com the free stock alerts, market alerts and stock charts website

Weekly Stock Charts review

Image
With the New Year well under way it's time to see what has passed over the past couple of weeks. Yong Pan has a swathe of short term 'sell' signals with creeping weakness in the longer time frames: Looks like we will start the full trading year with a shot of downside: With that background, how will the ascending triangle breakout hold? Long term signal(s) still some way from a new short signal (bears beware): Maurice Walker looks at the moving averages: The Driving Forces Of Momentum: Crosses, Candlesticks, and Histograms There is no doubt the volume is the final authority as to whether a directional move has any longevity. But moving averages and candlesticks can play an important role in helping us know if the move is legitimate, and be the driving force of momentum. A variety of moving average crossovers are used by traders these days. My personal preference is the double crossover method which utilizes the 5-day EMA with 20-day SMA (see the S&P 500 chart on page

Happy Christmas!

Back in the New Year. -EOM- Get the Fallond Newsletter Dr. Declan Fallon, Senior Market Technician, Zignals.com the free stock alerts, market alerts and stock charts website

Weekly Stock Charts review

Image
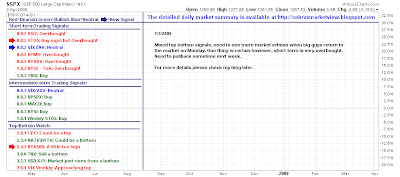
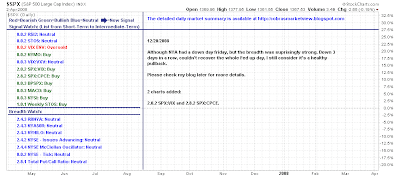
The last real trading week of the year has been a bit of a mixed bag. Santa will soon have come and gone, so is this it for his rally? Yong Pan has taken a distinctly neutral tone to his S&P breadth indicators, although his S&P take is bullish (with the exception of the single bearish signal 'creep') The bearish wedge remains in the SPY, except now things are looking overbought (and vulnerable to a sell off): Breadth indicators all showing 'buys'; intermediate time frame bullish even if the short term is a little rich: If there is a consolation prize it's that there hasn't been a significant distribution day since the post-Thanksgiving sell off: Maurice Walker has a bullish cross on record for the Aroon indicator: Maurice anticipates this rally lasting until the end of January (I think it will end around this time too) when 4Q GDP is released: The 4Q advanced figure will be announced towards the end of January 2009. I think the market will rally for a

Archive

Show more