The first full week of trading under the belt. How did it rate?
Yong Pan sees more neutral rather than outright negative action for the breadth indicators, but expects selling to continue - note the new Top/Bottom Watch:
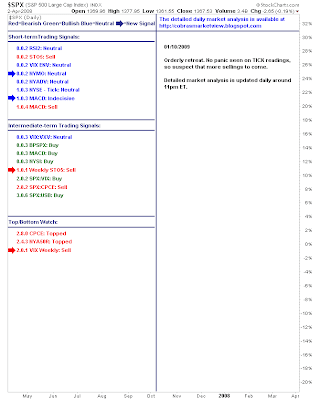 S&P top?

But SPY shows support at 20-day MA. I don't consider the bearish engulfing call strong because the market is not overbought:

Almost a MACD 'buy' on the S&P weekly?

Interesting view on the 30-minute SPY:

Maurice Walker talks "stimulus bubble" - click through for the full spiel:
Since the late 1990s the US has gone from a Tech Bubble, to a housing bubble, to commodities bubble. Next we will have a treasury bubble and then finally a stimulus bubble. But with the actions that the federal reserve is taking right now, we are setting up for the next two bubbles. The treasury bubble and the stimulus bubble!
First of all, let me say that I'm sure that President Bush and Barack Obama are fine men. Ironically, they both have similar approaches to stimulus and bailouts. I'm sure they are both nice guys, and my criticism is nothing personal against them. But when it comes to their economic policies, I think both men are making a huge blunder, by failing to see where their policies will eventually take the economy. Though they are acting with good intentions, their policies will result in the repercussions of unintended consequences.
This stimulus package that Barack Obama is proposing is massive , when you add that on to the previous Bush bailouts and stimulus package it becomes clear, what we are setting ourselfs up for is a stimulus bubble. If housing goes up 10 fold and all of the sudden we get a surplus of housing, and prices get so high, because of Fannie Mae and Freddie Mac guaranteeing everyone a mortgage via government intervention. Sooner or later prices become to high for people to afford and the bubble bursts. Naturally, prices must come down. But what is the government doing, attempting to modify mortgages, to prop housing prices back up. Offering direct aid to home owners, and promoting no foreclosure legislation. They want bankruptcy judges to intervene and rewrite mortgage contracts. They are attempting to keep the bubble going, and only setting themselfs up for a large bubble bursting down the road. Solving a debt crisis with more debt. That is precisely what the US government is doing.
Maurice's Aroon watch stays on the bulls side:

I like his downside target for the S&P on 15-min (880):

Short term momentum closer to oversold (but not fully oversold):

Big test for the 60-min QQQQ rising channel from November lows:

Richard Lehman is on downchannel watch:
1/10 -- One thing we do now have is more clarity on what's going on in the short term. Most short term charts now show a larger red minichannel downward that began this month, reversing December's' rally. Those minis are approaching the lower green upchannel lines and should hit them this week. The RUT (our usual get-there-first index) is almost on its lower line aready. Holding that lower green means holding to the uptrend we've been in since the November lows (even though the slope flattened from its original course once already) and is thus important. From the chart consensus, I suspect the green will hold for at least a bounce, but we need to be alert if it is violated.
If that violation is not very deep, we can get a flattening green as a result, rather than a new downleg back to the November lows. A lesser likelihood (though worth keeping in mind) is the retest of those lows. Everyone seems to think its coming, but no one knows when. The flattening scenario is already taking shape on the one year charts where the green upchannels there are flattening or breaking sideways. Remember, though that a sideways move can have swings inside it that are pretty significant (like 5-10%).
1/8 -- The short term charts are tracing out minor upswings following the two-day selloff, but I suspect that more immediate downside looms. We should know tomorrow when the highly anticipated employment numbers come out. What concerns me are the one-year charts. The DJIA, SPX, RUT and others are sitting on the lower green upchannel line. Any decline from here will take them out of those channels, even if only to create a sideways break. That may not be terribly bearish, but would certainly take a lot of wind out of near term bullish sails in those green channels. On the other hand, a bounce upward off those lines could be quite strong.
Joe and his week:

The January effect is not looking promising:
On the first trading day in Jan, 1-2-09, the S&P 500 opened at 902.99
1-8 *On the Fifth trading day S&P 500 closed at 909.73, which is only 006.74 points higher than the first trading day, which is Not enough difference to draw any conclusions. We'll wait and see what the month of Jan forecasts.
Finally, an unhealthy market:

With Futures pointing to a weak open the 20-day and 50-day MAs will be key.
Dr. Declan Fallon, Senior Market Technician, Zignals.com the free stock alerts, market alerts and stock charts website


