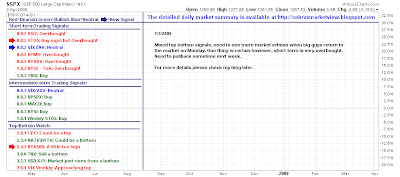
With the New Year well under way it's time to see what has passed over the past couple of weeks.
Yong Pan has a swathe of short term 'sell' signals with creeping weakness in the longer time frames:
 Looks like we will start the full trading year with a shot of downside:

With that background, how will the ascending triangle breakout hold?

Long term signal(s) still some way from a new short signal (bears beware):

Maurice Walker looks at the moving averages:
The Driving Forces Of Momentum:
Crosses, Candlesticks, and Histograms
There is no doubt the volume is the final authority as to whether a directional move has any longevity. But moving averages and candlesticks can play an important role in helping us know if the move is legitimate, and be the driving force of momentum.
A variety of moving average crossovers are used by traders these days. My personal preference is the double crossover method which utilizes the 5-day EMA with 20-day SMA (see the S&P 500 chart on page 3), and the triple crossover method, which implores the 10-, 20-, and 50 day EMAs which I call the moving average trio. The simplicity of moving average crossovers add to their appeal. When they cross it signals that a trade must be made. Regardless of which combination of moving averages are used or preferred, the trader is still looking for the same result. Momentum! Now I have been burned more than once on trade, getting a bum steer on a moving average set up. But there overall performance out weighs those occasions I found them wanting.
Both moving average systems I use, mentioned above are now bullish. That means it is a favorable environment for longs. Last week , on December 30 the 5-d EMA crossed above the 20-d SMA. Then the 10-d EMA crossed above the 20-d EMA on December 31. Previously the 10-/20-d EMAs were drifting sideways.
One solution to false moving average (MA)signals that lead to whipsaws, is to use MAs in conjunction with candlesticks to help determine just when, in the vicinity of a moving average crossover, the balance of power has shifted from the bulls to the bears or vice versa. For instance, this past week we saw the 10-d EMA cross above the 20-d EMA on December 31. The following trading session, we got a breakout of overhead resistance, producing the third candle of a bullish three white soldier pattern. This pattern is confirming the moving average.
Maurice is not buying into the negativity:
I have listened to a lot of technical traders in the past two weeks and most of them have salted there verbiage with bearish overtones. Despite, a barrage of pessimism among invertors and traders, I have continued to remain bullish on this market. The reversal signal came on November 21, when we saw a bullish engulfing reversal transpire on the daily charts. That pattern got a follow through as prices rocketed higher. From there, prices pulled back forming the right shoulder of an inverse head and shoulders pattern manifested on the hourly charts. The successful backtest of the broken intermediate trendline on the daily charts, served as support while prices moved in a lateral range forming various triangle patterns. Those triangles (continuation patterns) broke out on Friday.
We believe that the rally will carry prices to key resistance on daily charts. Take a look at the 60-minute charts of the DJIA, S&P 500, and the QQQQ below, and you will notice how the upper boundary of the minor trend channels in that timeframe intersect with horizontal resistance from the November 4 minor highs (election day in the US). The upper channel is rising resistance, which is pointing straight at horizontal resistance. That means that the 1007 level on SPX and the 9650 level on the DJIA will eventually ram right into a double dose of resistance. I suspect that this will occur just prior to the 4Q GDP being announce in January. I am betting that prices will run into resistance, while having to digest terrible economic data, which will be too much for the market to bare and extinguish the rally.


I do agree with Maurice that late Jan/Feb will see the end of the rally:
In late January and February, I anticipate that the ride will end, as the market takes a detour, driving right into the back roads of a desolate area, on a very bumpy road, with plenty of pot holes. I'm looking for more wild swings for multiple right shoulders to form on the daily charts. Then I expect the complex inverse head and shoulders pattern to be completed come March, and subsequently breakout.
Could I be wrong? Of course. If the technical picture changes I will be forced to reevaluate my analysis. But so far, this analysis has been spot on, and I won't abandon it unless my indicators say otherwise.
Two More Bullish Signs
The ADX has been a very valuable indicator to us in 2008. It forewarned of the September sell off in late August, by producing a bearish cross on the DI lines as the ADX began to rise. The Aroon confirmed the ADX indicator by flashing a sell signal on September 4 and the MACD on September 3. This past Friday marks the first time we have see a bullish cross of the DI lines on the index daily charts since late August. I believe after this initial run up, that the DI lines will begin to weave back and forth, while the right shoulders are being constructed. Once completed, I think prices will move higher as the positive DI line soars. Right now the ADX line (black line) is still falling, suggesting prices will rise as volatility declines, but no long term trend will be validated until the ADX line bottoms and begins to make its way back up and then rises above 20. Therefore, I submit shall not occur until after the right shoulders are complete.
The weekly histogram on the indices have moved above the zero line this week. That means that momentum has shifted in favor of the bulls. Next to a divergence, I think this is the most important signal in technical analysis. This histogram's push above zero allowed the MACD to get a bullish cross on the weekly charts, and we also saw a bottom failure swing on the RSI of the DJIA this past week.
Look at his LHS to see the potential complexity for the RHS in the months ahead:

Weekly chart bullish:

Joe Reed the weekly summary:

The January Barometer is back on the menu:

Maybe the top is not in place?

Ted Burge's 15-min Point-n-Figure chart for the S&P looks good for bulls:

Point-n-figure chart for the QQQQ:

Finally, Richard goes for the Santa Rally - look to small caps for leads:
1/3 -- The short term mini from Santa week extended itself on Friday to where it has broken the sideways action of December on the upside for the major indexes. This is certainly positive, but is still just a narrow minichannel and is heavily influenced by end-of-year seasonal effects. If it is to morph into a full-fledged short term upchannel, it will need to correct back to a point that can define the lower line. Meanwhile, the one-year charts are all looking better as breakouts of the one-year line are creating nice upward channels in which there is still a bit more upside.
1/1 -- Another year hits the history books, but the trends continue. The short term picture is that we are still in the predominantly sideways channels of the past two weeks or so that evolved from the original December rebound. The rally during the last two days of 2008 simply brought us back near the upper lines of that horizontal channel (though the RUT hit its upper line dead on and fell slightly back already.) While the New Year's pop was largely window dressing, history suggests the move may continue into the first week of the new year. The upper lines can be expected to provide resistance, but if momentum is strong enough, the indexes may eventually punch through, putting them back in short term uptrends. The small caps almost always lead the charge in early Jan if you are inclined to play the upside here.
Meanwhile, there was an important development on the one year charts. The Naz, QQQQ and SPX all broke their one-year downtrend lines! (The Dow and the RUT had broken a while ago.)As a result, the indexes now all show a mini channel heading up through the one-year channel line with additional room on the upside. They may (and in fact are likely to) retrace at some point back toward the breakout line, but we at least know the one-year down channel has been broken and that's a very good sign.
Dr. Declan Fallon, Senior Market Technician, Zignals.com the free stock alerts, market alerts and stock charts website


