Posts

Showing posts matching the search for Semiconductor channel breakout

Holding Last Week's Upside Gaps; Russell 2000 Poised

Image
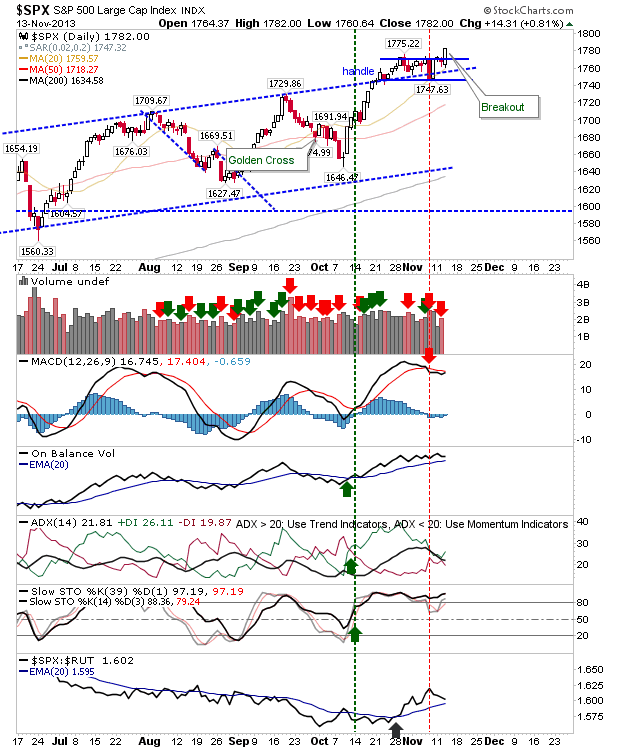
A shaky start to the week has so far managed to hold on to Friday's gains. The small gaps haven't filled although they are not true breakout gaps as we are still waiting for the actual breakouts. But, it's healthy action and the possible short opportunities mentioned from the drop outside of the channel don't look likely to succeed. The S&P is no longer in its rising channel but a slower advance may be emerging. The MACD is still on a 'sell' signal and relative performance remains on the bearish side.

Semiconductor's (Very Modest) Breakout Phase I

Image
There wasn't much on offer by the close of business as early losses were returned by the close. The Semiconductor Index may have had the best of the action, although the relative gain was small. The index crept over declining resistance, but has another resistance level to challenge soon. Support at 659 remains in play, but if it breaks it becomes a shorting opportunity.

Daily Market Commentary: Small Caps Break Channel

Image
Bulls were able to continue with yesterday's buying. Volume was lighter so there was a degree of uncertainty to accompany the buying. Small Caps pushed through its channel with a MACD trigger 'buy', but it has to break February highs before confidence can start to flow again. ($RUT) via StockCharts.com The Dow is in a battle between a minor channel breakout and resistance as defined by former support of the prior up trend. The good news for bulls is that it's the first index to turn net bullish technically. ($INDU) via StockCharts.com The Nasdaq 100 gapped powerfully higher - leaving behind a bullish island reversal. It has finished a shade below its 50-day MA which may curb buyer enthusiasm Friday. ($NDX) via StockCharts.com The semiconductor index also gapped to leave an island reversal. It has room to maneuver to its 50-day MA, with the 20-day MA current resistance. Looks good for a few more days of gains. ($SOX) via StockCharts.com How semiconduct

S&P Waits Another Day

Image
After the breakout in the Russell 2000 it had looked like the S&P was ready to follow suit, but Friday wasn't to be its day. The S&P experienced a relatively light point loss, but did register a distribution day. However, it remains primed for a breakout on Monday.

Stock Market Commentary: Break Tease!

Image
Tuesday's action looked to have given the bulls the impetus needed to firm Friday's reversal as a reversal, instead we got an inside day. Inside days build tension and suggest a big reaction to follow - which bulls hope will be higher. Is there a case for a channel breakout in the Nasdaq 100? The semiconductor index - which broke resistance yesterday - maintained its channel breakout with a second doji What today's action allows is for a tighter stop on the opposite side of the direction of the break (using today's high/low range). Dr. Declan Fallon, Senior Market Technician for Zignals.com , offers a range of stock trading strategies for global markets under the user id: ‘Fallond’, ‘ETFTrader’ and ‘Z_Strategy’ available through the latest rich internet application for finance, the Zignals Dashboard ; many are ranked in the top-20 for 3-month and YTD performance. Zignals offers a full suite of financial services including price and fundamental stock alerts , stock cha

Volume selling picks up as prices hold

Image
While sellers ticked up their activity there were enough buyers to keep prices stabilized, although supporting indicators have started to slowly rollover.  The one exception was the Semiconductor Index as it started the day at channel support and rallied higher. While the Semiconductor Index rallied off channel support it was left with a 'sell' trigger in the MACD and CCI. Price action is dominant so I have marked a 'buy' trigger at support but use a loss of the channel line as support.

Daily Market Commentary: Approaching Bull Traps

Image
Markets were able to take advantage of Futures strength, building on opening gaps and pushing higher into the close. Next are the bull traps created by the failed double bottoms. These bull traps form the anchor points for rising channels. Although there is probably another 1-2 days worth of gain before such supply becomes a concern. The S&P rally was on low volume but recent volume has been light. Look for resistance when the rising channel meets the falling 50-day MA (currently at 1,248). The Nasdaq is running closer to 2,616 resistance (June swing low) in addition to channel (and 'bull trap') resistance. It will likely find it harder to follow through on gains tomorrow than the S&P. What will help the Nasdaq is potential stealth accumulation in the semiconductor index. The angled channel is more likely to break into a sustainable rally rather than rising channels observed in major indices. The Russell 2000 enjoyed the biggest gain on the day but

Breakouts for Russell 2000, Semiconductors and Dow Industrials

Image
It was a bit of a mixed bag, although the basis for a probable swing low for markets is in place. Best of the action was in the Semiconductor Index where there was a clear break from the downward channel, which also coincided with a return above the 200-day MA. The consolidation below - and move above - the 200-day MA has the makings of a 'bear trap'. Next challenge is getting past the 20-day MA and if it can do this on the back of a MACD trigger 'buy' it will set things nicely for a challenge of the 50-day MA, then a larger challenge of the 52-week high at 1,604.

Fallondpicks.com: Weekend commentary

Image
Friday's focus was all on the large caps with a channel breakout in the S&P and a nudge over resistance in the Dow . Sympathy gains in the remaining markets kept the bulls interested without the powerful buying (i.e. heavier volume) associated with a follow through day. Moving average resistance remains limiting with the 20-day MAs in the NASDAQ , NASDAQ 100 and converged 20-day and 50-day MAs resistance in the Russell 2000 . The semiconductor index is similarly curtailed by the 20-day MA and channel resistance. These moving averages have halted every attempt at rallies since the breakdowns in May. Challenges on resistance will be backed by MACD bullish crosses in the NASDAQ , NASDAQ 100 , semiconductor index, Dow , S&P and Russell 2000 . For all indices the last crossover occurred in early June and kept markets in a sideways (to modest bullish) pattern for 3-weeks. Should this repeat it will help keep the indices primed for the all important follow through day.

S&P Nudges Breakout

Image
The S&P didn't break resistance with any great fanfare and the move lacked volume, but a breakout is a breakout. Technicals are in good shape with bullish momentum particularly strong, and a three month rising accumulation trend.

Small Caps Break Support

Image
Not since September of last year have we seen a selling day like Friday's. Hardest hit of the indices was the Russell 2000 as it broke below support of its rising channel. It remains above breakout support of $158s, but with new 'sell' triggers for the MACD, On-Balance-Volume and ADX. Relative performance versus the Nasdaq has been in freefall since mid-December and Friday's action didn't help. However, the weekly chart is the one to watch if you are holding long, and with 20- and 50-week MAs running closely aligned there is support to work with.

Daily Market Commentary: Russell 2000 Breakout

Image
On the third day. bulls were finally able to take out the Russell 2000's 'bull trap' created by September's breakout. Technicals improved without taking out the MACD trigger 'sell'.  Those smart enough to have bought the test of channel support will have done well.  Next target is channel resistance.

Quick Post: Markets Trade Near Highs Ready For 2018

Image
The last week of trading of 2017 looks to be ending near all-time highs, and with markets well placed to continue this form into 2018. The Russell 2000 is looking primed to jump higher with strong pressure at resistance. Of the indices, it's best placed to break higher - negating the November 'bull trap' in the process. The upper channel line is the target for the breakout.  Shorts will need a downside break of the squeeze line with a stop above 1,560.

Big Gains on Modest Volume

Image
After the sequence of selling, it was no surprise to see Bulls make a comeback. Friday's volume was relatively light compared to the day's gains, but some indices are well positioned for a further advance. Best of which is possibly the Semiconductor Index. The index rallied from converged trendline and breakout support. Buyers can use Friday's low as the risk level for a bounce. There are a few declining trendlines to break, but if these go then a retest of 704 is next; first trendline will see a test on Monday's open.

Daily Market Commentary: Breakouts Galore

Image
Well, shorts would have had a very short-term trade; the need for tight stops apparent after today's action. Indices powered in afternoon trading to fresh breakouts, setting in motion the next phase of the rally. The cleanest breakout belonged to the S&P. It didn't quite come with a MACD trigger 'buy', but this is likely tomorrow.

Daily Market Commentary: Nasdaq Breakout II

Image
There was only one index at the races on Friday. Strong volume action, and the close above 'Head' resistance, suggests the Nasdaq breakout has finally taken. The 'Bull Trap' hasn't totally been negated, but Friday's action was a big dent in it.

Vacation Time: July 4th => July 22nd

Image
No posts for the next couple of weeks. Trading volume was light with tight action in Large Caps, but a little give in Small Caps. Existing trends in play until proven otherwise, anything else risks overplaying background noise. Pointers to keep an eye out for over the coming weeks: S&P remains on course to tag the 10% 200-day MA envelope (grey dashed line). Channel and/or 20-day MA support may offer pullback opportunities.

Daily Market Commentary: Upside Follow Through

Image
Looks like the Dow didn't get the memo; all indices continued their advance, except for the Dow, which headed south until pulled back in the afternoon. The Nasdaq pushed forward with higher volume accumulation.  It finished the day at channel resistance, but with the breakout to back the bullish picture.

Market Indecision

Image
Between's Apple disappointing sale guidance, HSBC's 35,000 employee layoff plan, and lingering Coronavirus, it was looking like markets were heading towards a clear downward session - but this was not the case. Instead, there was a large degree of indecision as existing holders were reluctant to sell but few buyers were willing to step in to defend these elevated prices. On a pure technical view, markets look well positioned for further gains, the Russell 2000 in particular, but the Coronavirus  hasn't yet revealed its full impact on economic supply chains or consumer confidence. The key trigger (for me) remains the Russell 2000. The channel breakout remains valid, even if the index hasn't yet blown past 52-week highs. Technicals are good, although On-Balance-Volume is on the verge of a 'sell' trigger. Relative market performance remains very poor and is a long way from a new 'buy' trigger.

S&P Breakout + Tech Support Bounce

Image
If volume wasn't just a little disappointing this would have been considered a super solid day for bulls. Having said that, shorts will be feeling the squeeze and anyone short the Dow Jones would have been feeling particularly aggrieved. Momentum bull-runner the Dow Jones gapped at the open and finished at the high of the day. Relative performance actually dropped a little but the Dow is clawing back 6-months of under-performance so it can be forgiven for this.

Archive

Show more