Posts

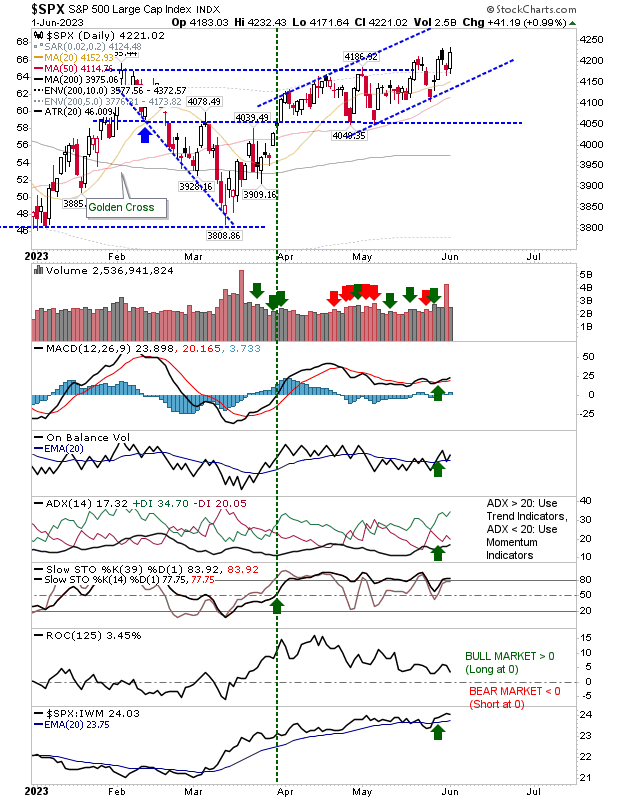
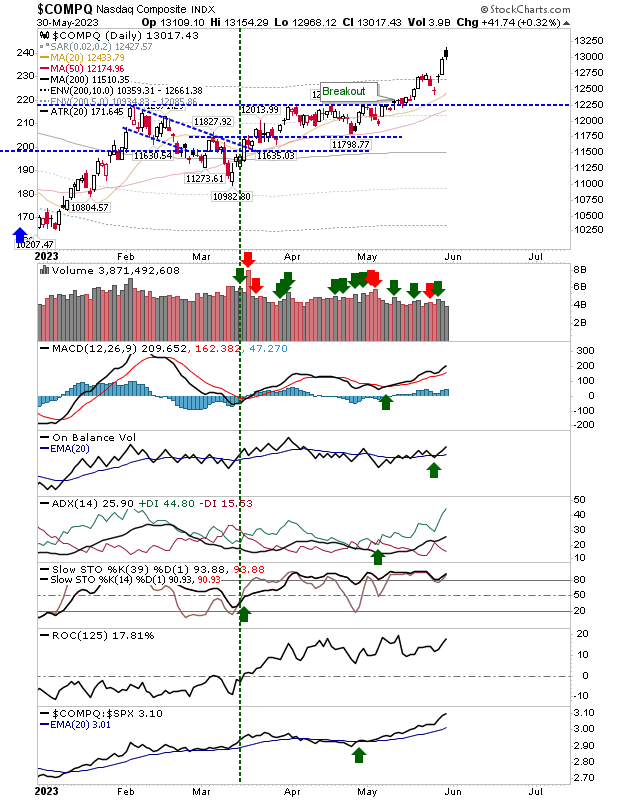
S&P and Nasdaq rally in their bases.

Image
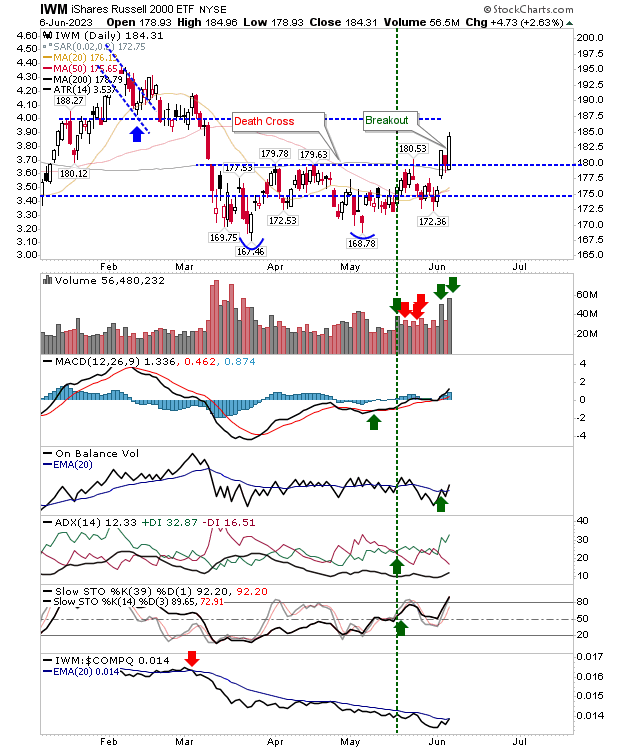
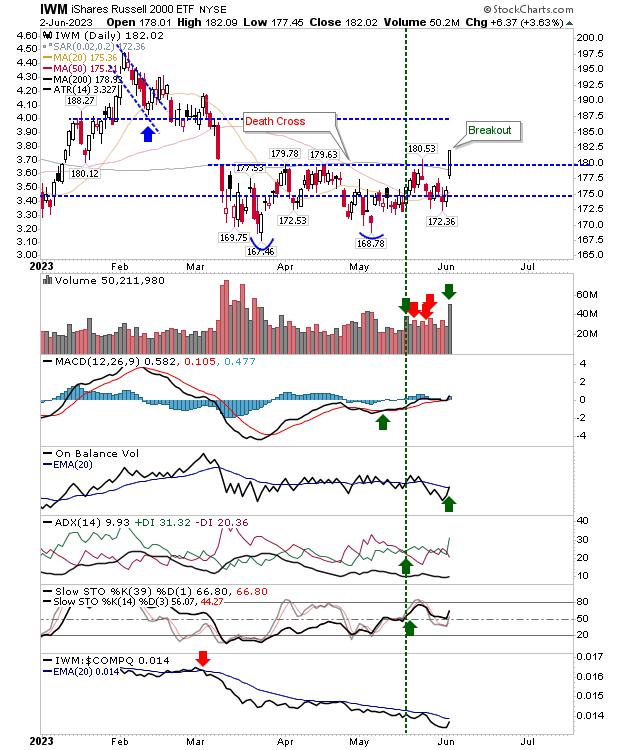
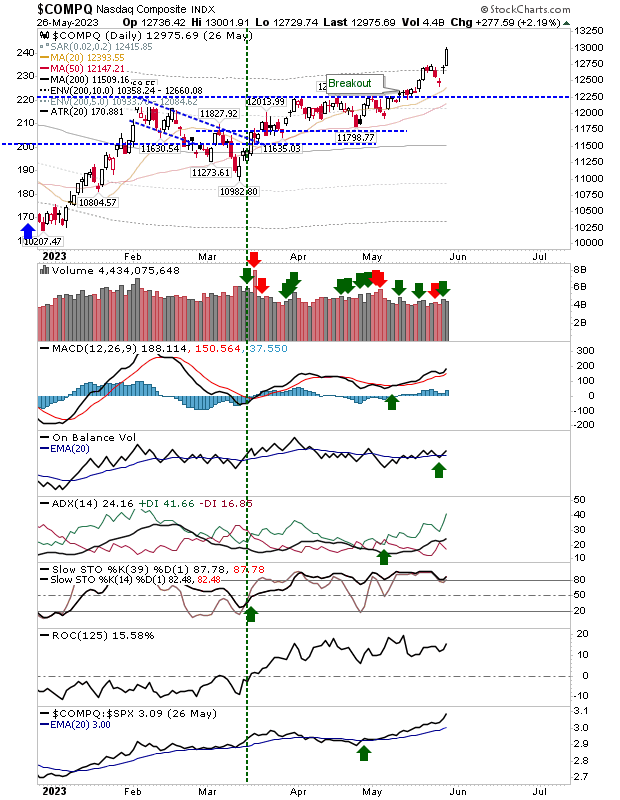
Currently on vacation, so posting intermittently until after July 4th. Suffice it to say, the S&P and Nasdaq are well on their way to shaping the right-hand side of bases coming off 2021 highs.  There is still a chance these bases can fail, but until I next post, I expect these rallies to continue on weekly timeframes.

Russell 2000, S&P and Nasdaq all kick on

Image
It would have been nice to see some volume to go with today's buying, but we don't always get what we want. The Russell 2000 pushed into the early year consolidation, breaking well away from the spring/early summer consolidation that had threatened something alot worse. Technicals for the index are net positive and after a long period of relative underpeformance to the S&P and Nasdaq, it's now the lead index.

Russell 2000 continues to surge

Image
After weeks of listless action, the Russell 2000 ($IWM) has suddenly come to life. A second day of strong buying, ranked as accumulation, has offered volume comparable to the selling in March (but now as buying).  Relative performance hasn't fully moved in the Russell 2000s favor, but it's only a day away from outperforming both the strongly performing Nasdaq, and the S&P.  Once it gets to $187s it will start to run into congestion/resistance from the start of the year. 

Russell 2000 breaks free of congestion

Image
It was a good day for markets, but it was the Russell 2000 that went on a bender, pushing itself out of its scrappy, multi-week base and slicing through its 200-day MA. Not only that, it managed to clear $180 resistance, which means it's now in the process of shaping a right-hand-side base.  This is important development as other indices are challenging resistance on weekly timeframes.  There is room for the Russell 2000 to test support, and an intraday spike below $180 would be acceptable, as long as the index ends the day above $180. 

S&P "Bull Trap" negated as sellers lose momentum

Image
It's not exactly text book, but whenever bears are able to punish markets they are quickly undone, often by a single day of strong buying.  The S&P is an ideal case in point. After trading below 4,165 for a number of weeks it has managed a confidence restoring push above 4,200. Each rise in price will squeeze shorts to help drive the index above its 2023 scrappy action.  Ultimately, we will want to see a move comparable to what's occurring in the Nasdaq.

Peak "Black Candlesticks" again offer cause for concern

Image
With junior traders likely to be still holding the reigns after the long weekend it was worrisome to see 'black' candlesticks pop into the charts of the Nasdaq and S&P.  If there is a bullish caveat, it's that the significance of these candlesticks is reduced in the absence of a prior rally.  The Nasdaq is perhaps the most vulnerable in this regard, but only because it has extended itself beyond its breakout point. However, I would expect this index to come back towards the 12,250 level over the coming days and weeks.

Solid gains into Memorial Weekend as Semiconductors surge

Image
Friday offered itself as a solid day for bulls, the only thing it lacked was volume. All indices gained, even the struggling Russell 2000 ($IWM), although some of my individual stock plays haven't enjoyed such gains.  The Nasdaq enjoyed the best of the action has it builds on its (now) well establish breakout.  It currently trades 12.7% above its 200-day MA, which by the table at the bottom of the post is just shy of 15% of historic price extremes (and a time to take profits or sell a 'covered call').  Technicals are net positive and the index is accelerating in relative performance against the S&P.

Archive

Show more