Posts

Mini-Correction in March Bounce

Image
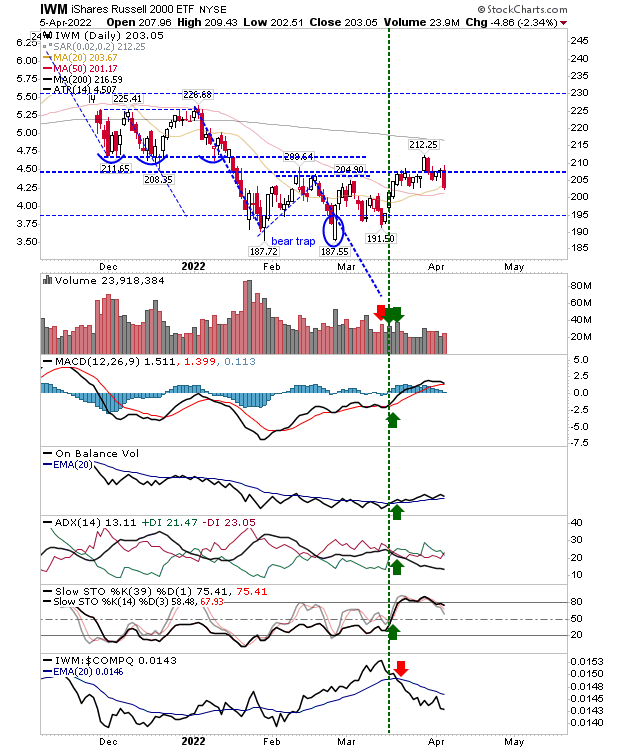
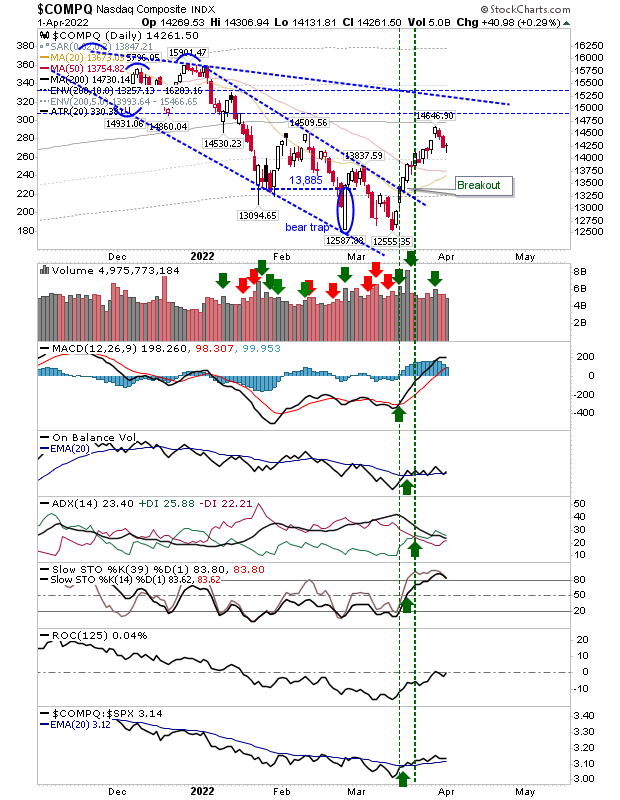
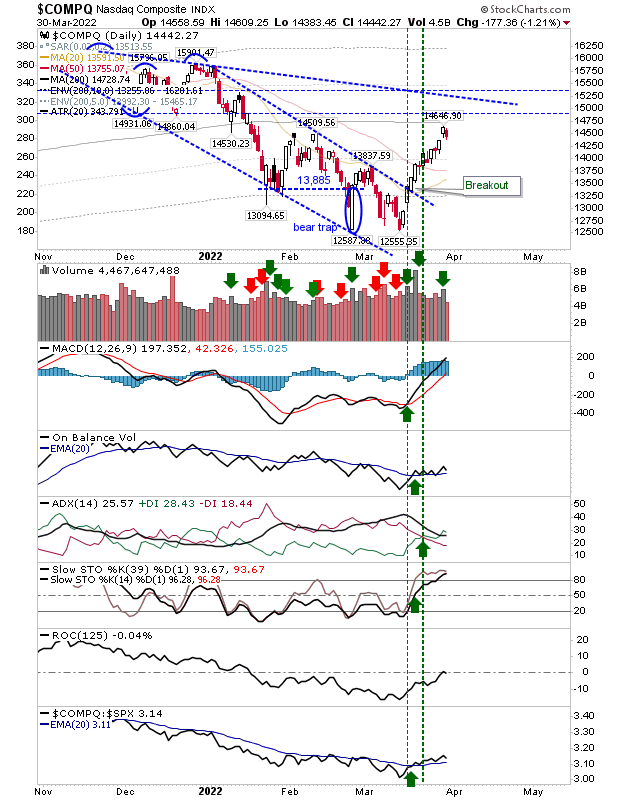
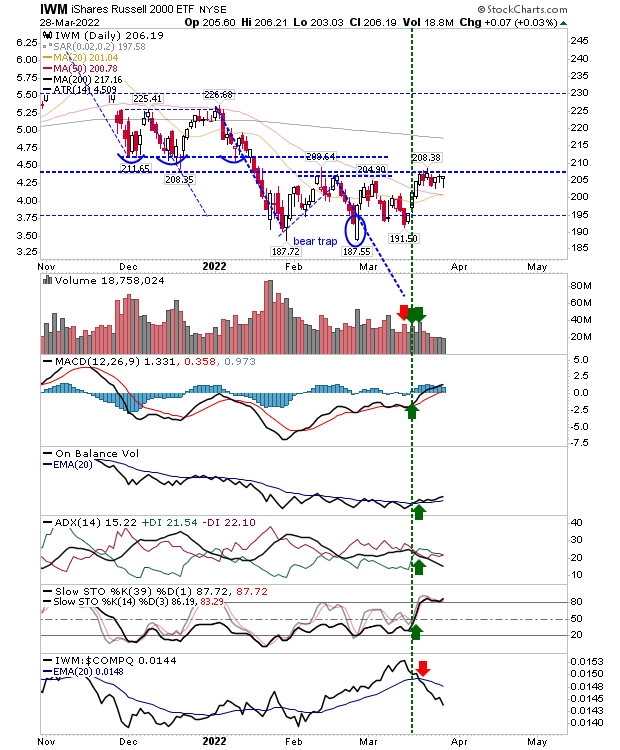
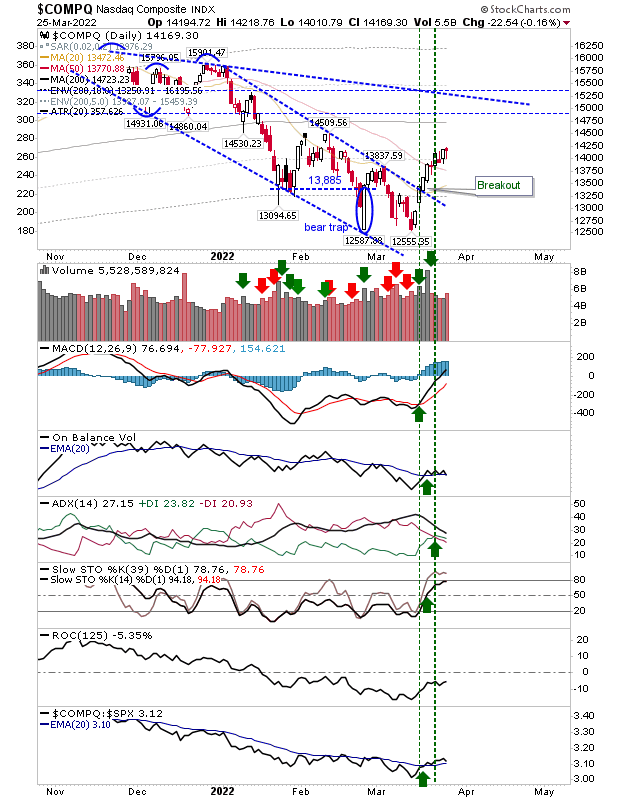
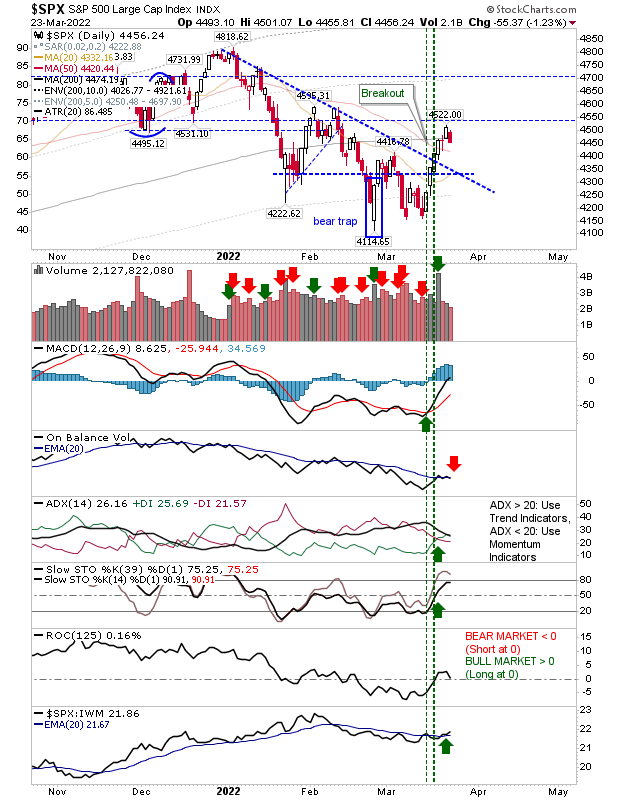
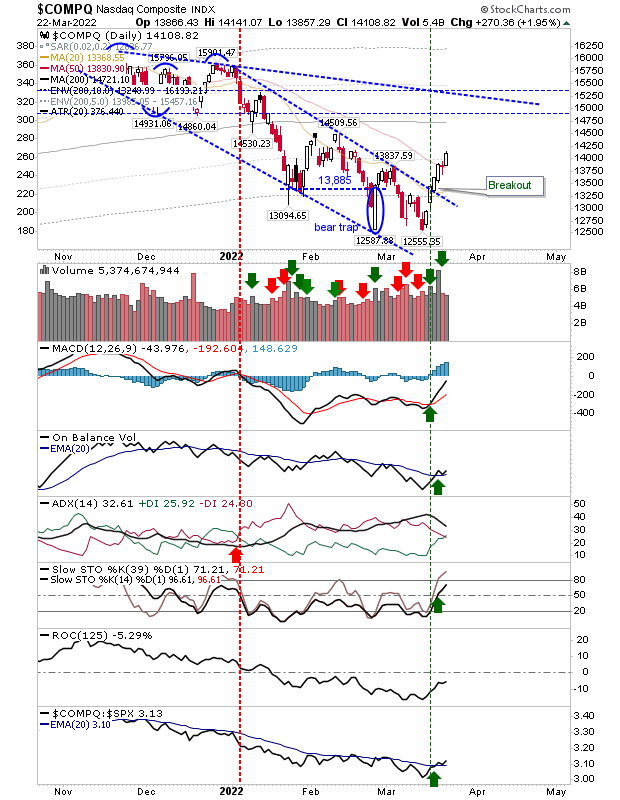
It has taken a while, but we are finally seeing the correction in the rally which was started by the (surprising) rally following the February low test.  It looks like a buyers pullback, but there may yet be further losses before we see this move done.  The index most impacted by today's selling was the Russell 2000 as it lost its base-building breakout, and prices were returned into its earlier base.  Selling volume was relatively light (compared to January), but today's trading qualified as a distribution day.  Technicals remain net positive and it will now have the 50-day MA to lean on as support. 

Indices consolidate late week losses

Image
Last Wednesday and Thursday delivered the first real losses for this rally since it started around 3 weeks ago, but Friday but a nice 'full stop' to these losses - enough to offer buyers a relatively low risk:reward play for those seeking a trade. The Nasdaq finished with a doji, and potential bullish harami cross.  The latter is weakened by the lack of oversold momentum (stochastics) indicator.  However the Nasdaq is enjoying a relative outperformance over the S&P.

Low volume selling after Russell 2000 breakout

Image
Yesterday finally delivered the long awaited breakout in the Russell 2000 on higher volume accumulation.  Today saw some low key selling on lighter volume, but the selling was not accompanied by distribution. The Nasdaq still offers net bullish technicals, but today's selling kicked in on the test of its 200-day MA. Yesterday's buying did count for accumulation. 

Russell 2000 is ready to breakout

Image
Another day passes with the Russell 2000 primed to breakout.  Today saw another small bullish 'hammer' just below resistance even as relative performance against the Nasdaq and S&P continued to plummet.  Buying volume was light, so this is an index biding its time until it's again noticed. 

The Mini-Bounce Continues Across Indices

Image
Friday was a relatively low key day, but there can't be many shorts left in the market after the rally from lows enters its third week.  I would like to see some downside just to gauge the level of demand from where there was a failed rally in early March.  Technicals remain vulnerable but do side with bulls. In the case of the Nasdaq, I would like to see a move back to test 13,250, but if there is a surge past 14,500 then I would look to the latter as new support.  The 200-day MA at 14,725 could also have a say in this rally.  Certainly, bulls were happy to buy 12,500 and it seems that particular low is here to stay for the forseeable future. There is good strength in Stochastics and the MACD, with the index outperforming the S&P - so Tech stocks should continue to attract investment. 

Pause in Buying as Indices Give Back Yesterday's Gains

Image
Markets returned most of the ground gained yesterday in what could be the start of the next pull back.  The percentage loss may have made some headlines, but the damage to the charts was relatievly minor. The S&P edged just below the 200-day MA with a 'sell' trigger in On-Balance-Volume. If the selling continues I would be looking for a test of former declining resistance - now support, which is also close to its 20-day MA. 

Rallies Continue Across Markets

Image
After yesterday's brief pause, today was a return to normal service (for bulls).  The Nasdaq pushed through its 50-day MA, although buying volume did not register as accumulation. However, On-Balance-Volume is building off a 'buy' territory.  In addition to getting past its 50-day MA it also took out the March swing high. The index is outperforming the S&P as part of this move. 

Archive

Show more