Posts

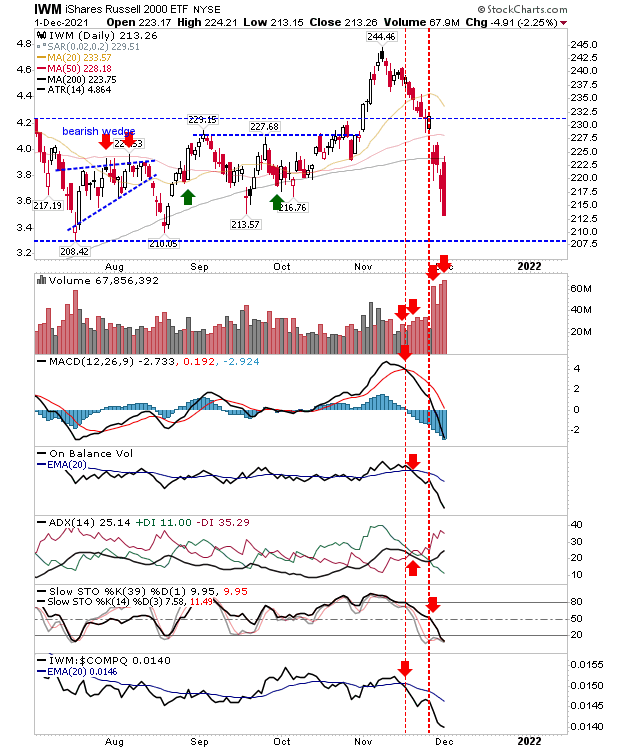
Nasdaq breaks support as the Russell 2000 continues to fall

Image
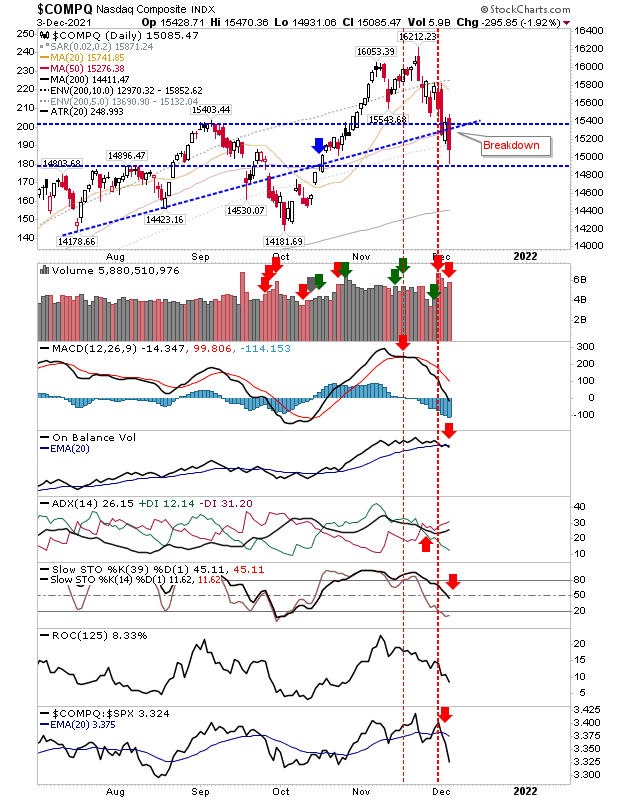
Indices continue to fall as traders grab profits before the holidays. While the Russell 2000 is the index feeling the most pain it handed the headlines over to the Nasdaq on Friday when it undercut its 50-day MA, on higher volume distribution. Technicals are net negative, but internediate term stochastics are not oversold.  The index is underperforming relative to the S&P as it works its way towards its 200-day MA.

Russell 2000 Rout

Image
There was little doubt about who was in control of markets today.  Sellers swooped in across markets but it was the Russell 2000 which took the worst of it.  There was a brief attempt to recover the 200-day MA, but aside from that it was sellers all the way.  Volume rose to register as distribution, adding to the malaise in the market.  Technicals are net negative, but stochastics are oversold and a rebound is not far off. 

The week starts with weakness for the Russell 2000

Image
Not the best of starts for the Russell 2000 as the opening gap higher drifted back into a lower close.  The finish was still enough to register support of the 200-day MA, but as long as sellers keep feeding piranha style on the carcass it will struggle to recover.  The index did enough to hold on to the 200-day MA but technicals remain net negative but stochastics are not yet oversold.        

Was Black Friday Selling Meaningful?

Image
Holiday trading rarely marks the start of a major trend change as junior traders look after desks until their bosses return from the holiday.  But bosses won't be happy with the shift their minions have put in over the Thanksgiving weekend.  Last Wednesday's gains do feel like a long time ago. The Russell 2000 is the barometer for the broader market. It really has no more room for maneuver as the index gapped down to its 200-day MA with technicals net bearish.  Relative performance has also moved sharply against it relative to the Nasdaq and S&P.  Volume climbed to register as distribution, adding to the misery.  After waiting so long for the breakout in 2021, the index now finds itself looking in the other direction. 

Russell 2000 attempts to defend 50-day MA

Image
Indices pushed to reverse yesterday's losses with respectable gains. Best of the indices was the Russell 2000.  Despite been unable to hold breakout support it has managed to defend its 50-day MA - at least for now.  Technicals, aside from stochastics [39,1], are bearish - but those intermediate time frame stochastics are finally at a level where swing low support typically kicks in for an asset in a bull market. This confluence of support might be the recipe to save Small Caps and put a stop to the selling. 

Bearish engulfing patterns strike markets

Image
The week started with bearish engulfing patterns for all indices. Hardest hit was the Nasdaq as it failed to hold on to morning gains triggered off the gap.  The drop was attributed to Jerome Powell's second term appointment, but the double top off resistance offered a more technical signal.   The Nasdaq is primed to retest 15,550 after failing to hold new all-time highs. Selling volume registered as distribution, but aside from the MACD 'sell', the technical picture was unchanged.

Support test in the Russell 2000

Image
All action appears to be focused on the Russell 2000 as it drifted toward breakout support as other indices protect their swing low rallies. The Russell 2000 nearly tagged $232 breakout support on today's spike low, but rallied back to its 20-day MA by the close.  In the case of the Russell 2000, where volume spiked it did so on days of distribution selling. We now have 'sell' triggers in the MACD, On-Balance-Volume and ADX.  Not surprising, relative performance has shifted away from the Russell 2000 towards Tech and Large Cap indices. 

Archive

Show more