Posts

A Range Of Market Scenarios In Play

Image
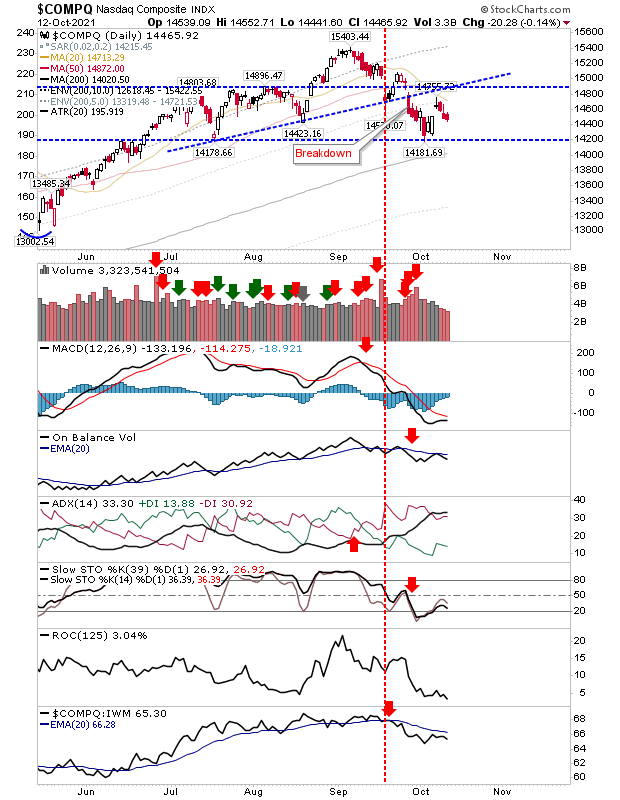
The week finished with markets in a number of difference scenarios.  In the case of the Nasdaq, the rally has returned to former 3-month support - now resistance.  Volume climbed to reigster as confirmed distribution.  It came on a back of a MACD trigger 'buy' and an On-Balance-Volume 'buy' trigger.

Tightening range as gaps fill

Image
While markets may be feeling the pinch of the gap fill from the swing low rally, we have a narrowing of the intraday range in an attempt to confirm support from the gaps.  In the case of the Nasdaq, we have the gap fill on declining volume which is a point of optimism that what we have is a valid swing low. Technicals are net negative and relative performance is not improving enough to suggest we may have a real swing low, but take things one step at a time. 

Small bearish engulfing patterns for markets

Image
In candlestick terms, markets finished Friday with a series of bearish engulfing patterns against Thursday's 'real body' finishes. It did put a bit of a dampner on Thursday's bounce although the extent of the losses were relatively minor. Watch for a test of the gap early next week.  Aggressive traders could 'buy' the test and set a stop on a loss of the swing low at 14,100, although a close below the gap would probably offer enough reason to sell before the stop. 

Bounce runs out of steam?

Image
Yesterday's gain marked the start of a potential swing low but there wasn't much momentum to the bounce. In the case of the Nasdaq we had a 'gravestone doji'.  While this candlestick did not occur at a swing high or on overbought momentum, it's not one to inspire confidence on day 1 of the bounce. Technicals are firmly net negative, so expectation is for a downward move tomorrow.

Relief buying has potential for more

Image
Today's buying was able to erase much of yesterday's losses, although trading volume was below that of Monday. Given the declines in lead indices, what happened today has the potential to act as a swing low - it's just whether nearby 200-day MAs would not prove to be a better point for buyers to come in to support the indices.   The Nasdaq rallied from a prior support area - one which also corresponded to the July swing low. Technicals are net negative with a big swing against it when it comes to relative performance against the Russell 2000. 

Swing Low for Indices?

Image
Friday was an first attempt by bulls to build a swing low since peaking in early September. Lead indices finished with bullish candlesticks on oversold momentum indicators.  Volume was down on previous selling, so any follow through will need some confirmed accumulation - but Friday was a good start. The Nasdaq finished with a bullish hammer and is well placed for a follow through higher on Monday.  The key negative is the relative performance weakness of the index to the Russell 2000 and the fact this index is a long way from testing its 200-day MA. 

S&P pushes lower as Russell 2000 tags 200-day MA for a third time in two months

Image
The S&P followed through on its continuation pattern by delivering a solid red candlestick lower. Those big red candlesticks have also come with bearish distribution.  Next stop is the 200-day MA on net bearish technicals. 

Archive

Show more