Posts

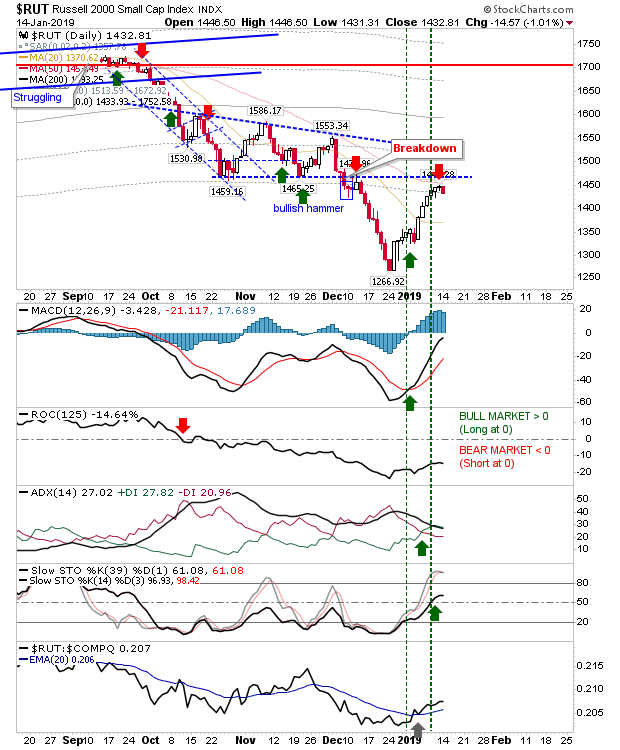
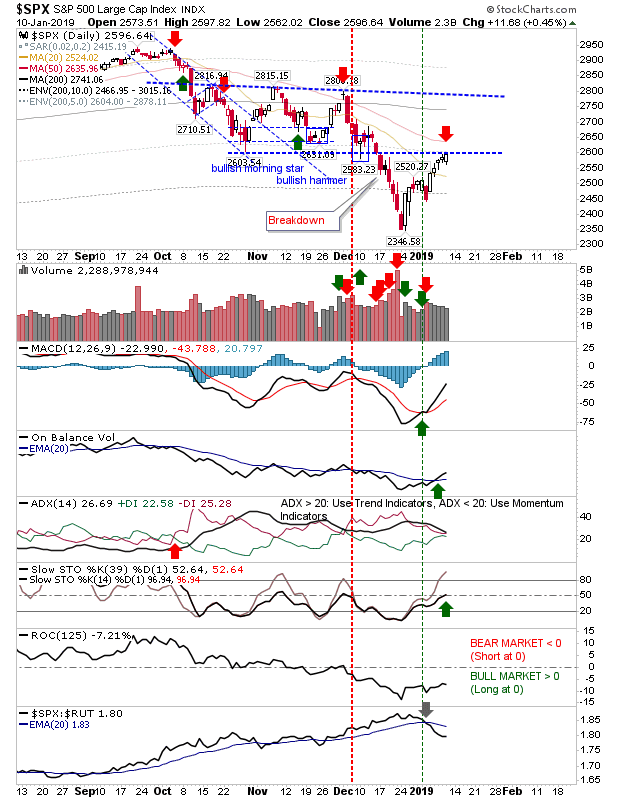
Short Trades Limp Out

Image
Yesterday's swing trade will have stopped out the aggressive short trades at the narrow doji, where the doji range was used as a stop. Shorts using the 50-day MA as a stop will still have a little room left to play with. Those looking for a new shorting opportunity may use today's doji as the entry trigger; shorting loss of doji low with stop on break of doji high (or a long trade on the reverse break). The aforementioned trade looks clearest on the S&P where it edged above resistance but not enough to break beyond the 50-day MA; I have marked a second (short) entry signal but if it closes above the 50-day MA then the last chance saloon for these trades will be done. It's a similar picture for the Dow Industrials Somewhat ironically, the Semiconductors might have the best shorting play; we have a close near the low of the day after peaking last week. The index is above the 50-day MA but it's not looking like it will stay there much longer. There is an

Swing trade breaks in Shorts favour but no follow through lower.

Image
From a pure price perspective, the suggested swing trades broke to the downside, but the lack of follow-through beyond the opening hour doesn't suggest shorts are going to win here.  However, until last Thursday's/Friday's highs are breached the short plays can probably be held until they are decisively beaten. Ohers could look to a hedge with a long trade using a stop on a break of today's lows. With long/short covered the risk is whipsaw. The Russell 2000 was the only index to finish with a lower close and if shorts are going to win out then this is likely to be the index to deliver.

Has the bounce peaked?

Image
Friday offered a day of tight trading on low volume. Swing traders can take advantage of this by trading a break of Friday's range (buy break of high/short loss of low) and setting a stop on the flip side of Thursday's range (of Friday's if you want to take on less risk). This set-up looks the most logical for the S&P. The S&P again kept to resistance defined by the October spike low and now has the 50-day MA offering some additional resistance. Technicals have edged bullish except the Directional indicator which has been slowing since November; an indication of a possible switch to a trading range. Going forward, I would be looking for a shallow decline, perhaps to the 2,500s, before prices stabilize as a sideways range. Again, look to this a swing trade because if Monday starts brightly and can maintain that strength after the opening half hour it will stress existing shorts into covering their positions and open up for a move to the 200-day MA.

S&P & Dow Jones reaches resistance

Image
Large Cap Indices finished right on resistance from the October and November swing lows; Tech indices had already tagged and breached comparable levels so the expectation is for a breach here too, but aggressive shorts can look to attack here. Stochastics [39,1] are at the 50-midline - the cut-off between a bull and bear market and both MACD and On-Balance-Volume are bullish.

Archive

Show more