Posts

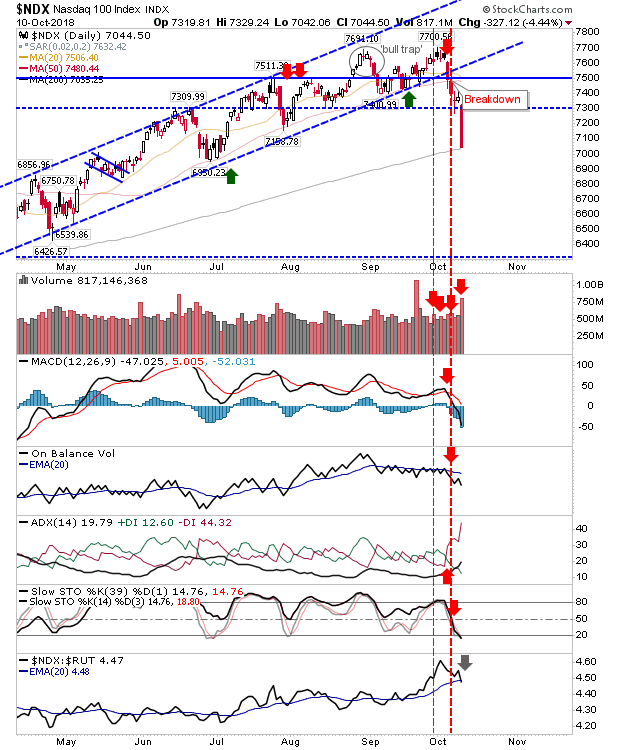
Indices Defend 200-day MAs

Image
Last week's selling had put pressure on markets not seen since 2016 but the run of good form has meant Tech and Large Cap Indices are only now testing 200-day MAs. There was a brief overshoot on Thursday but the week closed more settled. The S&P did well to make it back to its 200-day MA but it complicates the risk:reward which now has a loss of 2,710 as the place for a stop which is well outside most comfort zones. Given that, I would look for some retest of 2,710.

Buy Signals Blown Away

Image
The support levels which were on offer for the Russell 2000, Dow Jones Industrial Average and S&P were undone by the biggest 1-day loss in the year. Not surprisingly, volume rose in distribution as traders bailed.  The only index to finish on support was the Nasdaq 100. Although with a 4%+ loss it would be a brave trader to be buying the 200-day MA.

Buy Small Caps.

Image
Today is a simple call for action. On Friday, the Russell 2000 tagged its 200-day MA in a manner which was picture perfect for those peppering the 200-day MA with GTC 'buy' orders.  Monday was the second chance for a slice of this action with another tag of the 200-day MA. If there is a 200-day MA fail it will be a clean sell but as this is oversold on near-term and intermediate stochastics it's looking like a relatively low risk buy with stops on a loss of 1,615 and an initial target of 1,715 - a healthy risk:reward with the index closing at 1,630.

Russell 2000 Tags 200-day MA; S&P at 50-day MA; Semiconductor Cracks

Image
Indices recorded another set of losses but some now offer an opportunity for longs. Best of these belong to the Russell 2000. The Russell 2000 managed a picture perfect tag of the 200-day MA with Friday's lows making it to 1,618. Shorts trading the tag (of the 200-day MA) will have come out with a nice profit and aggressive longs may have also used the opportunity to trade a bounce with a buy.

Archive

Show more