Posts

Tech Indices Ignore Semiconductor Weakness to Breakout

Image
Tech Indices are not waiting on the Semiconductor Index aa both the Nasdaq and Nasdaq 100 closed at new all-time highs. The Nasdaq 100 had the best response with a clear breakout. This move accelerated the relative advance against the Russell 2000 setting things up nicely for a challenge of upper channel resistance.

Markets Stumble As June Highs Challenged

Image
It was by no means a disaster but there was an ominous feel to Wednesday's close. Bulls had used the momentum built by last week's gains to make a run at all-time highs but profit takers and shorts used this as an opportunity to get out/build a position. It's a typical stage I reaction to a resistance test but now it's a question if there is enough sideline interest from bulls to drive a break to new all-time highs and force today's shorts to cover. The S&P left a small 'bull trap' on low volume. Technicals are net bullish so if bulls can come back and reverse the 'bull trap' it would nicely set up a run to test newly drawn channel resistance. But for now, shorts look favoured.

Friday's Gains Deliver Breakout

Image
The past couple of weeks have been a period of give-and-take but Friday broke the mold by marking a second day of gains for many of the indices (four for the Russell 2000). More importantly, it took markets above resistance and into a position where they can mount a challenge of June highs.

Trading Ranges Dominant

Image
Tuesday delivered another shift with sellers coming back, although not to the same extent as Monday's buying. The net result was to leave trading ranges in key markets. Until there is a break we won't know where the nest move will come but it will keep people on the sidelines until there is a resolution.

Monday was to Friday as Friday was to Thursday

Image
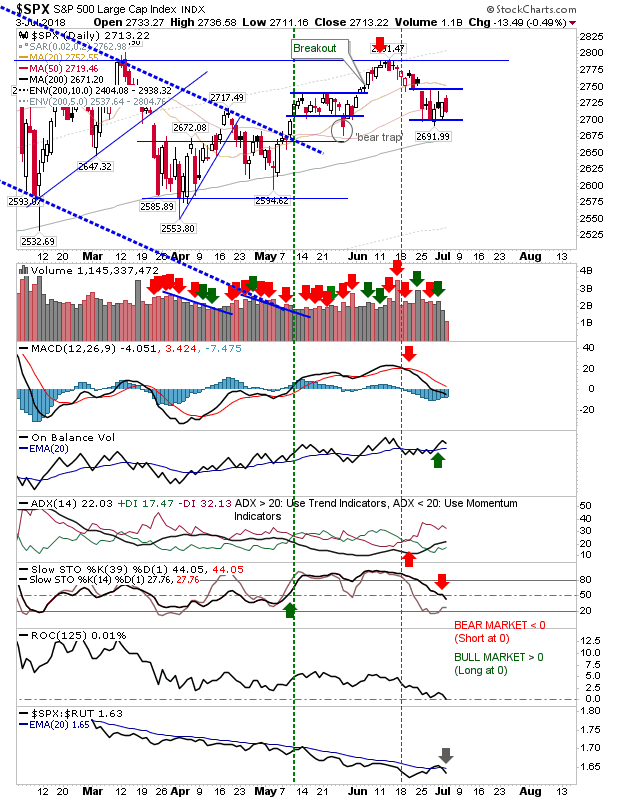
In yet another turnaround for markets, today started with a large gap down which had the makings of a sizable bearish sell-off - only for bulls to start buying from the open and to continue to do so throughout the day.  Better still, today's surge undid much of the damage done Friday. For the S&P, the action over the last six days has much in common with the scrappy action around the 200-day MA in March/April. The only thing I don't like about this action is the frequency of the tests of the 200-day MA; the more frequent the tests the greater the chance for a break. A move above the 20-day MA should be enough to confirm a new swing low and deliver a challenge on resistance of the June swing high; riskreward measured on a loss of 2,690.  There was even an uptick in relative strength against the Russell 2000.

Supply Issues Emerge As Bounce Stalls

Image
Friday's action didn't bring about the bounce I would have liked after Thursday's picture-perfect defenses of lead moving averages or support. The S&P closed with a bearish black candlestick on a spike high above the 50-day MA. Volume climbed in accumulation as On-Balance-Volume triggered a 'buy' signal. I would see this as a bearish close and would look for downside Monday; potentially playing for a test of the 200-day MA

Markets Defend Moving Averages; Good Buying Opportunitites

Image
It was not particularly pretty but it was effective. There was no further drive lower but traders were happy to step in to defend moving averages; those who made the leap were rewarded with an attractive risk:reward opportunity.

Archive

Show more