Posts

Better from Bulls - Shorts Failing to Apply Pressure

Image
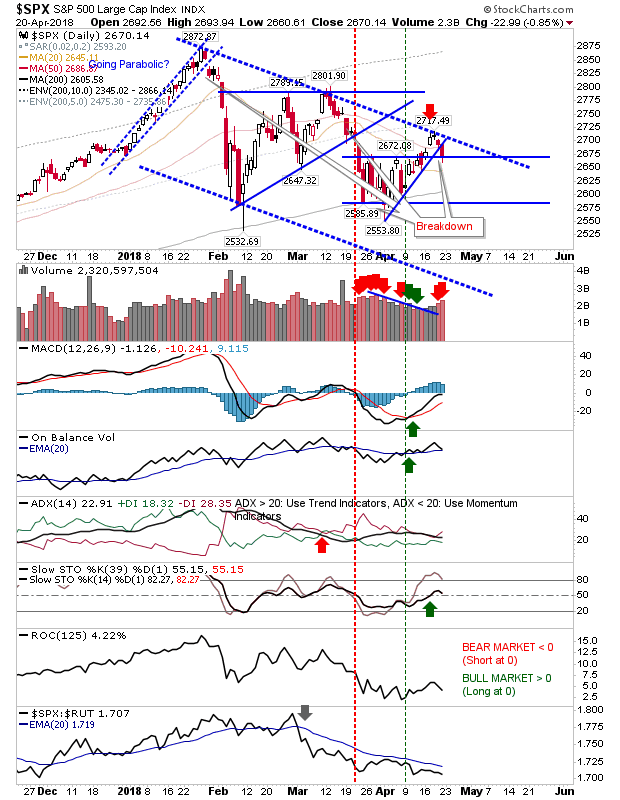
Since the breakdown in wedge support it had looked easier for bears to push indices down to 200-day MAs or lower channel support but action over the last week with two bullish hammers suggests longs may have a launch pad to work with. The S&P is offering a nice setup with the 'bullish hammers' just above the 200-day MAs. The only disappointment was the 'sell' signal in relative performance in the Russell 2000.

Mixed Setups; Something for Bulls and Bears

Image
Markets started the day strong - challenging resistance - but were unable to press this advantage.  Many indices closed lower, leaving 'black candlesticks' which are typically bearish when formed at 'swing highs' but still favor weakness even in the absence of the swing high setup. The 'black candlestick' for the Nasdaq at resistance suggests a move towards the 200-day MA but for this to happen there needs to be an immediate downside; any recovery has a strong chance of negating the 'black candlestick'.

Bulls Buying The Bounce Offered Little

Image
Yesterday's recovery set the groundwork for a bounce but the gap higher took away most of the opportunity the bullish set-up offered. Weakness at this point would be bearish so wouldn't be buying but if in then hold until the morning breakout gap closes and reassess. The S&P generated a small uptick in relative performance but not enough to trigger a 'buy' signal yet. Other technials are mixed with 'buy' signals in the MACD and On-Balance-Volume are offset by 'sell' triggers in +DI/-DI and Stochastics.

S&P To Test 200-day MA

Image
After yesterday's selling today's late recovery was a chance for bulls to catch some breadth. The S&P came close to tagging the 200-day MA on the intraday low. The index is on a path to the lower channel. There was no technical change and relative performance remains weak.

Shorts Kick On

Image
There was no Sleeper (long) play for the S&P as sellers took control across all indices. Losses of between 1-2% took effect in Large Cap, Small Cap and Technology indices. The S&P cut clean through horizontal support, 20-day and 50-day MAs, but was never able to challenge channel resistance. Look for a move down to channel support. Technicals are a mix of bullish and bearish signals.

Semiconductors Approach 200-day MA; S&P Sleeper Play

Image
There were modest losses today with most indices holding the status quo from Friday. The one exception was the Semiconductor Index as it lost over 1% in a confirmed break of support. However, it does have the 200-day MA for a likely test tomorrow. All technicals are negative and relative performance took another step lower but no change there.

Shorts In Play

Image
Friday's selling confirmed the second shorting opportunity with support breakdowns across lead indices. The S&P closed with higher volume distribution on a breakdown of rising support. Relative performance remains weak although there are still 'buy' triggers for MACD and On-Balance-Volume.

Archive

Show more