Posts

Short Opportunity Negated

Image
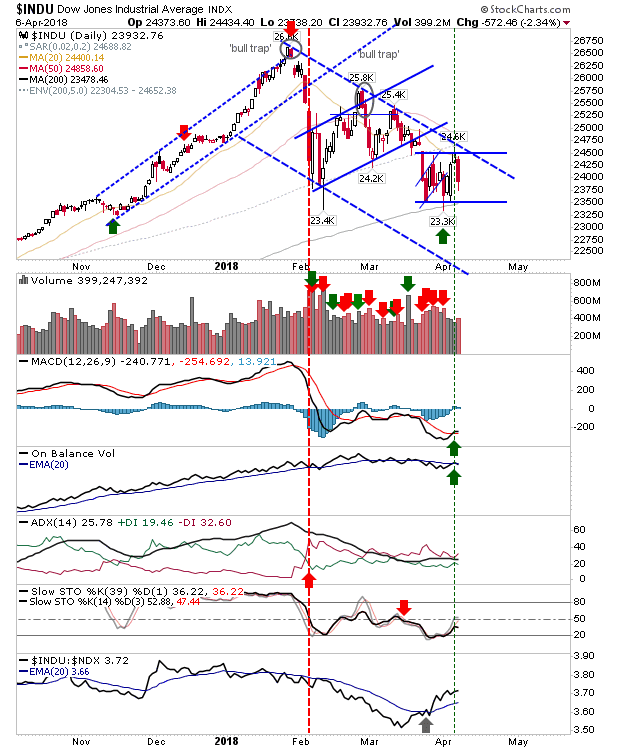
Well, that didn't last long. The shorting opportunities which offered themselves yesterday didn't last the morning; morning gaps held beyond the first half-hour of trading and bar a small sell-off into the close markets finished higher and above key moving averages and trading channels. The Dow created a breakout which now offers a potential long play. Stops go on a loss of 24,600. Technicals finished with a new long 'buy' trigger in Stochastics.

Shorting Opportunities?

Image
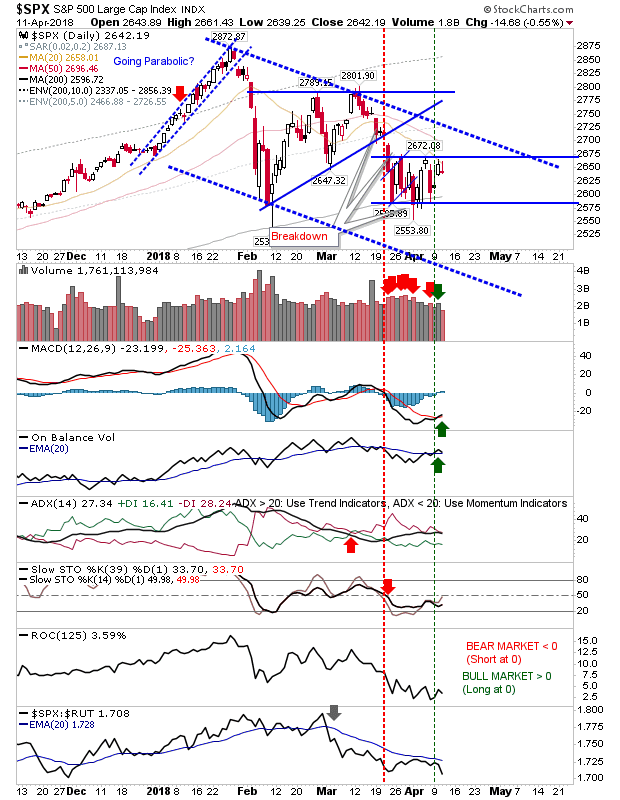
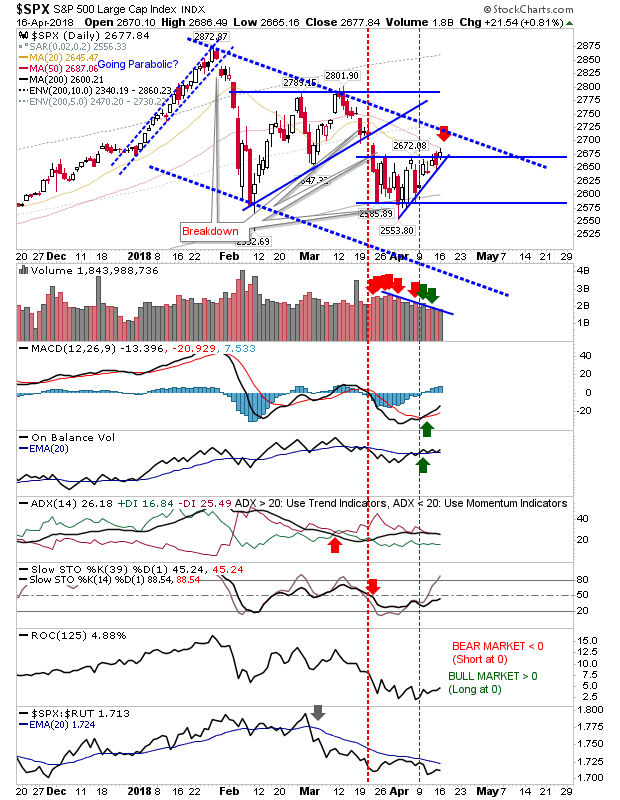
The indices are edging higher but the presence of 50-day MAs and/or channel resistance overhead does offer an opportunity for shorts to take a position. Market action does appear to be favouring bearish wedges with prices moving towards an apex on declining volume. The current apathy will break and how it does will define the direction of the next market phase. Today's action in the S&P left the index pinned to its 50-day MA. The tight intraday range offers a low-risk short play with a stop above the 50-day MA and an entry on the break of the ascending support line

Tentative Breakouts Fail To Hang On

Image
Markets had started Friday above the marked consolidations I had drawn on the charts but subsequently ended the week still inside these trading ranges. As a two-day pattern, Friday's close finished as a bearish engulfing pattern across markets which means I'll be looking for a break of newly drawn ascending support (of the last 8 days) in these indices. The S&P still has a MACD and On-Balance-Volume  trigger 'buy' signals but Friday's high (and the high of the bearish engulfing pattern) was the 50-day MA. Sidelined bulls will want to see a convincing break of the 50-day MA, and probably the downward channel before committing. Bears have the easier play - helped by the strong relative underperformance of the index against its peers. Short the loss of Friday's low with a stop above 2,680.

Range Trading Continues

Image
Tuesday saw some upside from Monday's recovery but the trading ranges I marked on the charts over the weekend remain valid so no change in the status quo. The S&P shows this best with the trading range defined by the former 'bull flag'. Today's close left the index just below resistance. The lower close could suggest another run back to 2,590s.

Have the FAANGs come to the end of their bullish run or is there still life in the tech sector? How are you allocating for that going forward?

Posted on Investing.com " It has been a rocky start to 2018 with direct and indirect Trump factors; for example, Cambridge Analytica (+ fake news distribution), Trump vs Jeff Bezos and a new tariff war, hitting certain FAANG stocks, with the contagion spreading to those indirectly impacted and the broader Tech sector. But not-to-long ago, the same Trump factors were driving the post-election rally; ‘Business Man’ leader, accelerated deregulation with industry friendly appointments, funding cuts to regulatory agencies and massive tax cuts favoring the investment classes. In reality, the “Trump factor” is a bit of a red herring; it’s the uncertainty and randomness of what may come – be it Trump, terrorists or natural disaster - rather than what has come that’s the problem. With that in mind, we can only consider how markets value FAANG component stocks here-and-now."

Dow Breakout Stalls; Semiconductors Make or Break.

Image
The earlier moving Dow Jones got pegged back a little as it fell inside its prior consolidation. Similar moves appeared for the S&P and Tech Averages but as these were still range bound prior to Friday their selling was not as noticed. Markets are in a 50:50 tug-of-war between bulls and bears as these (now) 3-week consolidations work their way to a conclusion. I have redrawn the consolidation for the Dow. Friday's mini-breakout could be viewed as 'bull trap' but I think it's probably fairer to broaden the resistance level for the consolidation. The 200-day MA again looks important but another test so close to its last maybe one too many.  Volume climbed to count as distribution but overall volume was still quite light. Technicals are mixed.

Dow Breakout

Image
Markets look to have found a new routine with 200-day MAs acting as working support. The 'bear flags' I had marked for the S&P and Dow Jones Industrial average look toast given the latter index has broken resistance from what now looks to be a horizontal consolidation. However, the larger consolidation from all-time highs has yet to be challenged but could see a test Friday or Monday.

Archive

Show more