Posts

Bulls Work on Establishing a Market Low

Image
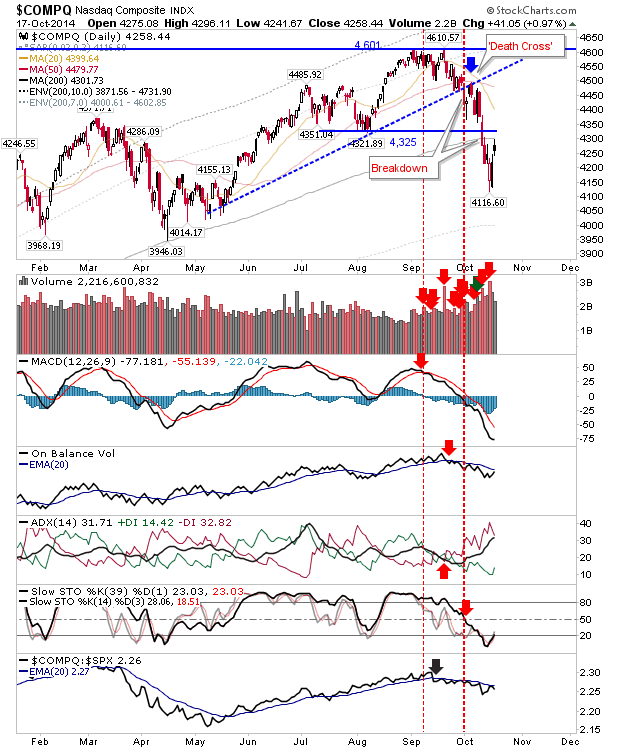
Friday's gains helped put some distance on Wednesday's spike reversals. This will offer bulls something to defend when selling inevitable returns. Friday's action didn't all go bulls' way as key moving averages played a role in halting the advance for a couple of indices. In the case of the Nasdaq, the blocker was the 200-day MA. Friday's high tagged the 200-day MA before weakening - although there was a bit of a recovery into the close. The index is no longer oversold, giving bears an opportunity to turn the screw again.  However, a close above the 200-day MA would give bulls confidence that last week was a low of note.

Contained Buying for Indices

Image
It wasn't the day I expected, but bulls can take some comfort it wasn't worse.  Some indices fared better than others. The S&P finished on the bearish side, despite closing a little higher. The inside day to yesterday's wide range day looks like something which will deliver more weakness in the days ahead. A close above yesterday's high would confirm a bottom (maybe not 'the' bottom), but this is something for tomorrow. A 2011 style bottom would still need another 5-6% decline to suggest this.

Bullish Engulfing Pattern in Russell 2000 and Semiconductor Index

Image
While I think markets are close to a swing low, I'm not entirely sure the bottom is there yet. The wide range day and spike lows are setup for a walk-down retest of these lows over the coming weeks. However, today was a step in the right direction for a near term bounce. Best of the action was in the Russell 2000 and Semiconductor Index. The Russell 2000 finished with a sizable bullish engulfing action that finished the day next to channel resistance. Tomorrow is set up for an upside channel break.

Volatile Flat Day for Indices

Image
Contained Volatility is perhaps the best way to describe Tuesday's action. By the time markets closed there was little change from open prices, but it was a bit of a roller coaster ride getting there. Not surprisingly, Small Caps had the best of the action, although relative to what's gone before it was a small change, but it's making big ground relative to Tech and Large Cap indices. The index remains within the sharp falling channel, which is unsustainable in the short term and will likely break upside sooner rather than later. At that point, I would be looking for a trading range in preparation for the next move up or down.  It has already tagged the 10% bottom percentile of loss relative to the 200-day MA (at -8.8%, taken from table below), so now is a good time to be taking nibbles on fundamentally strong Small Caps trading at a discount: look for Small Caps breaking or trading near highs (not necessarily 52-week highs: I like looking at action near 6-month highs).

Third Big Sell Off in a Row.

Image
The S&P took another big hit to the face as sellers rushed to the exits in late afternoon trading. The 200-day MA was barely noticed on the way down and the August swing low cleanly sliced.  Technicals are oversold and volume is in line with a capitulation, although I would be more comfortable calling a bottom once the index is at least 10% below its 200-day MA (which is 1,714).

Semiconductors Hammered

Image
While markets experienced broad selling, it was semiconductors which took the brunt of sellers wrath on weak prospects for the sector. Unfortunately, given the importance of semiconductors at the heart of Technology and therefore, the global economy, there will likely be further repercussions going forward.  The near 7% loss in the Semiconductor Index paid no respect to daily support, opening up support levels on the weekly time frame. The 200-week MA has entered the 61.8% fib retracement zone and is a potential target for the months ahead.

One Step Forward, Two Steps Back

Image
It feels like 2009 again, except markets are still above 200-day MAs, and less than 10% from its highs (bar Small Caps). After the relative mediocrity of summer trading, things look to have been flipped on their head. Except, that things haven't really changed. The S&P hasn't yet tested the August swing low, and will soon have the 200-day MA to offer support. It has only dipped into oversold territory, which suggests a good chance for further losses. With wide range days it's hard to pick entry/exit points, although I would favor a series of inside days from here: a coil would set up a swing trade on a break, but it may take a few days to form.

Archive

Show more