Posts

Weekly Market Commentary: Breadth Not Oversold

Image
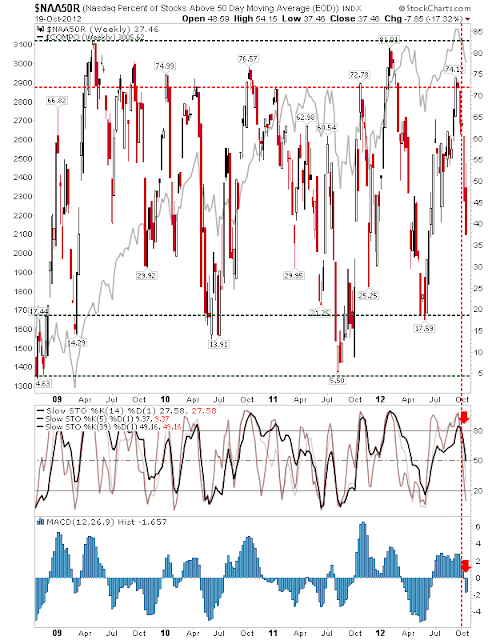
The last few weeks have seen sharp losses in market breadth strength.  The week past was no exception, although losses weren't as great as others in recent weeks. Breadth indices have still to reach oversold conditions, which would suggest a tradable swing low, so look for downside to continue. The Percentage of Nasdaq Stocks above the 50-day MA finished the week at 34%, but is perhaps two weeks away from turning oversold.  Any rally from this point is likely to be temporary.  Which will only delay the development of a stronger swing low. The Nasdaq Bullish Percents saw its biggest loss since posting a swing high. Technicals are middling, but it never reached overbough conditions, despite a decent rally from April's 2012 bottom.  The MACD histogram is on the verge of a 'sell' signal, so further downside is favoured. The Nasdaq Summation Index is the smoothest of the three breadth indices I track. Last week saw sharp losses as it cut below zero. Like the Bull

Daily Market Commentary: Brief Respite

Image
The market sided with neither bulls nor bears. The bullish play for the Nasdaq and Nasdaq 100 still holds, with today's small gain enough to keep the trade live. Despite the lack of nearby support for the semiconductor index, it is enjoying a relative strength shift in its favor against the Nasdaq 100. The Russell 2000 finished with another doji.  It had looked liked it was going to make another pass at its 200-day MA, but bulls were resilient enough to prevent this from happening. The S&P was relatively non-eventful. Play for a move down to its 200-day MA. Otherwise, what was said yesterday, still holds today.  Buy the Nasdaq and Nasdaq 100 / Sell the S&P. --- Follow Me on Twitter Dr. Declan Fallon is the Senior Market Technician and Community Director for Zignals.com . I offer a range of stock trading strategies for global markets which can be Previewed for Free with delayed trade signals. You can also view the top-10 best trading strategi

Daily Market Commentary: Sellers Maintain Control

Image
For a brief moment on Wednesday it had looked like bulls were going to get some change out of the market. But, by the close of business, bears had again reasserted themselves, and left indices close to, or at their lows. Hardest hit was again the Semiconductor index.  It suffered a large intraday swing which left it looking downwards, towards the summer double bottom low around 348.  If there is an inkling of a possible swing low, it's the bullish divergences in the CCI and MACD histogram, but technicals are otherwise bearish and have not indicated such a swing lows is in place. The net effect of the selling in the semiconductor index was to leave the Nasdaq and Nasdaq 100 with another pass on their 200-day MAs. Selling volume has been heavy, particularly for the Nasdaq 100; since the September high there have been 8 distributions days to 1 accumulation day.  Bulls buying the 200-day MA would want to be nimble on their feet if Thursday saw a close below this key long term su

Daily Market Commentary: Further Selling

Image
It was substantial move down for the indices, bringing the Nasdaq and Russell 2000 to their respective 200-day MAs.  These indices will offer something more for bulls to work with tomorrow. The Nasdaq is well placed to stage a rally on Wednesday. Selling volume, while higher, was below what passed for Friday's action.  Technicals are all bearish, but stochastics are oversold, thus offering a starting point to mount a recovery.  A stop just below the 200-day MA should be sufficient protection. The Russell 2000 made a larger spike down to its 200-day MA.  Where there is a concern, it's that the spike down to the 200-day MA occurred below the band of support marked by 820.  A bright start in the morning would offer confidence which could be built on. Losing out in the shuffle was the S&P.  It broke below the rising channel, sending it on its way towards its 200-day MA. The Dow turned net bearish technically. With two days of heavy selling in three, there

Daily Market Commentary: Late Day Rally

Image
Buyers managed a late day surge, recovering some of the losses following Friday's huge sell off.  For some of the indices, buying occurred before major support was reached, questioning the validity of this buying. One index jumping the gun was the Nasdaq 100. In early trading, there was very little follow through selling from Friday. However, subsequent buying occurred well above what is looking likely to be next support at 2,650.  The presence of the 200-day MA around 2,650 lends further weight to a potential test here.  Today's recovery may evolve into nothing more than a relief rally, but the 200-day MA is looking more probable as a support level. The semiconductor index finished with a doji, and didn't undercut the prior swing low to any great degree.  However, technicals returned to the bearish front after a failed attempt at a 'buy' signal in the MACD.  The only clear support is the double bottom at 348, so it's questionable whether there is enough

Weekly Market Commentary: Breadth Weakness Continues

Image
Another week, another set of breadth losses for the indices. The Nasdaq was the worst hit of the indices.  The Percentage of Nasdaq Stocks above 50-day MA finished  at lows of 37%, but stochastics are only half-way towards oversold territory. The Summation Index only saw marginal more losses than last week. It closed the week below 0, but the index doesn't typically reach oversold levels until below -600. This could take another few weeks before a swing low is reached. The Bullish Percents similarly experienced a small loss.  Technicals are in neutral territory, but still net bearish.  Still looks to offer plenty of downside before a swing low is reached. Despite the brief respite on the daily timeframe, the weekly chart for the Nasdaq favours a move to 2,863 support.  Higher volume selling marked confirmed distribution. While tech struggles, Large Caps held their ground.  The Dow and S&P held support for another week. And the Russell 2000 finished

Stock Review: Time Warner ($TWC)

My latest stock review covers Time Warner .  Other stock reviews can be found here . Follow Me on Twitter

Archive

Show more