Posts

Daily Market Commentary: S&P Test of 20-day MA

Image
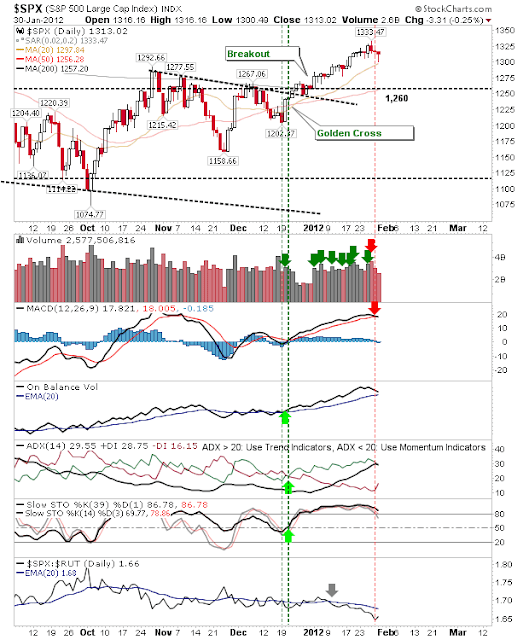
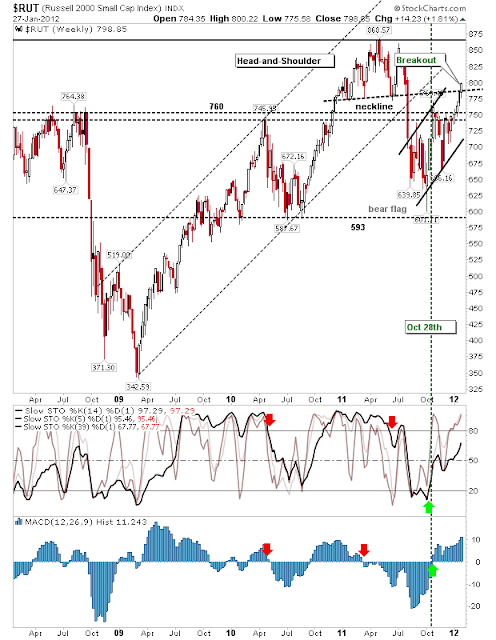
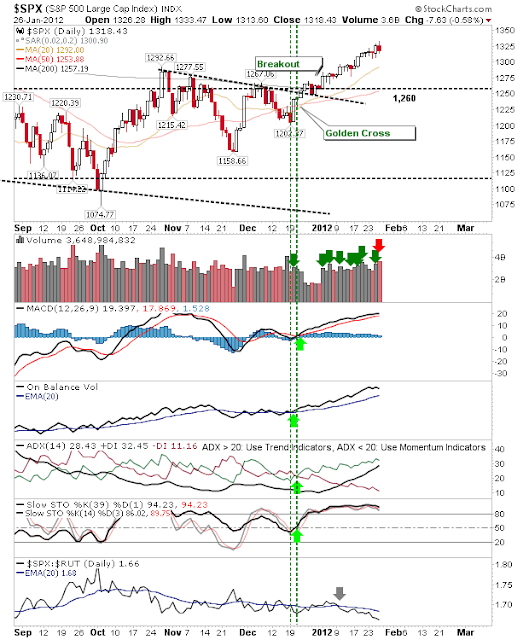
The early morning dive across markets took the S&P and Dow Jones Index down to their respective 20-day MAs. All indices were able to recover by the close, but not before triggering technical 'sell' signals for MACDs for the aforementioned indices. Bull can take comfort from the sharp drop in trade volume; it was well below that of last week and didn't rank as distribution. Today's touch of the 20-day MA in the S&P looks like a successful support test, but should there be a second test this week then it will likely break and the 50-day MA becomes the next support level. Trading in the Nasdaq was more robust. The index was able to close inside Friday's range and is well above its 20-day MA. Technicals remain bullish. Because the Russell 2000 didn't suffer the same losses at the open it did close down, although the net loss from Friday was slight. Monday's trading is in line with typical bullish behavior; i.e. small losses on low volume

Weekly Market Commentary: Breadth Breakout

Image
The past week saw some significant moves despite the weaker Friday close. For the indices there was a breakout in the Russell 2000. This cleared the former neckline and brought the index into the congestion zone of the early part of 2011. The Nasdaq also edged a breakout on higher volume accumulation, although the real challenge is the 2011 high. Supporting the break in the Nasdaq was the break in declining resistance of the Percentage of Nasdaq Stocks above the 50-day MA: The Nasdaq Bullish Percents also cleared declining resistance at 58%, leaving room to maneuver to the next (minor) level at 65%. Along with declining resistance in the Summation Index. The S&P built on its breakout from last week with another gain on higher volume accumulation This followed similar breaks in S&P market breadth. The weekly picture continues to look good for bulls. Last week's breakouts in the S&P were followed by breaks for the Nasdaq and Russell 200

Daily Market Commentary: Sellers Make First Appearance in S&P for 2012

Image
Today was the first distribution day for the year in the S&P and the second for the Nasdaq.  Despite the selling there was little change on the nature of the rally. A sequence of selling would obviously change this, but today offered little more than profit taking. Selling in the S&P retraced some, but not all of yesterday's gains. If this is the start of a longer decline then the 20-day MA is the likely support area for buyers to make their next appearance. The Nasdaq is in the same position, although there is a support level at 2,737 which may play as an alternative for buyers to step in. The Russell 2000 also has the benefit of the 20-day MA which has converged with 764 support to help buyers. The extent of today's selling volume is likely to see some follow through tomorrow. Not until 20-day MAs are tested will the integrity of the rally be known. ------ Follow Me on Twitter Dr. Declan Fallon is the Senior Market Technician and Community

Daily Market Commentary: Higher Volume Accumulation

Image
Bulls were able to keep the party going as yesterday's consolidation gave way to a day of buying. Volume climbed in confirmed accumulation for all key indices. However, gains in the S&P didn't slow the relative swing form Large Caps to Small Caps (Russell 2000). Or Tech Stocks Although there is a fine balance between demand for Tech and Small Cap stocks - which in itself reflects good diversification in money flow to the markets. Today's action reflects a continuation of the rally kicked off in October and confirmed in December. The Nasdaq 100 is already trading at all-time highs and it looks like the Nasdaq will soon be following suit.  On a weekly time frame, gains for Tech indices have the appearance of base breakouts and may suggest an overall lengthening of the bull market, perhaps to last through 2012. There is little on offer for bears.  While the rally may encourage profit taking, there is little on offer to suggest going short is an option

Daily Market Commentary: Low Volume Consolidation

Image
Despite missing yesterday's update there was little to split today's or yesterday's action. The only index to attempt to put some distance on the two days was the Russell 2000. Small Caps again attempted to retake the leadership role off Tech stocks as relative strength swung back in their favour; there was even a 'Golden Cross' between the 20-day and 200-day MAs. The S&P had two flat days, but technicals kept ticking higher at the expense of a loss in relative strength against the Russell 2000. While the Nasdaq posted a small point gain as Tech stocks continued to pull away from Large Caps. Bulls have the most to be happy with as indices continue to post gains as relative strength pushes more towards speculative issues (=> attracting money from the sidelines). ----- Follow Me on Twitter Dr. Declan Fallon is the Senior Market Technician and Community Director for Zignals.com . I offer a range of stock trading strategies for global m

Weekly Market Commentary: Another Good Week For Indices

Image
Nothing fancy for the week, just steady gains for indices.  These gains keep in play the rally from October. Market breadth continued to improve alongside index gains. Certain market breadth indicators are at declining resistance dating back to 2010, important tests, because breach these and the rallies will be well placed to continue for the next few weeks (if not months). The Percentage of Nasdaq Stocks above the 50-day MA is one such market breadth indicator at resistance. With 72% of stocks above this intermediate trend average it suggests the Nasdaq is only in the early phase of its rally (a couple of weeks ago the percentage of Nasdaq Stocks above 50%, was just above 50%). Nasdaq Bullish Percents are above the 50% mark And the Summation Index is above zero These breadth indicators suggest there should be enough for the Nasdaq to break declining resistance (already breached for Small and Large Cap indices) and push on to new highs. The Russell 2000 has made i

Daily Market Commentary: Semiconductors Blast Through 200-day MA

Image
Yesterday, semiconductors were stalling out at their 200-day MA; today there was no holding it back. The day started with a gap and didn't look back. In the process of breaking the 200-day MA it also negated the October and November 'Bull Traps'. The gain was also accompanied with a 'Golden Cross' between 20-day and 50-day MAs. The 5% move in the semiconductor index was also good news for the Nasdaq. The Nasdaq broke past 2,737 resistance defined from the October swing high and registered an accumulation day. The December-January rally continues to drive improvement in technicals as the relative shift from Large Caps to Technology issues intensifies. The Nasdaq 100 similarly broke resistance on higher volume accumulation. The Russell 2000 took a back seat on the action, but not before it added nearly 2%.  It was able to break resistance last week so is slightly ahead of the curve, despite losing ground against the Nasdaq. The long side remains th

Archive

Show more