Posts

Daily Market Commentary: Rally Ticks Along

Image
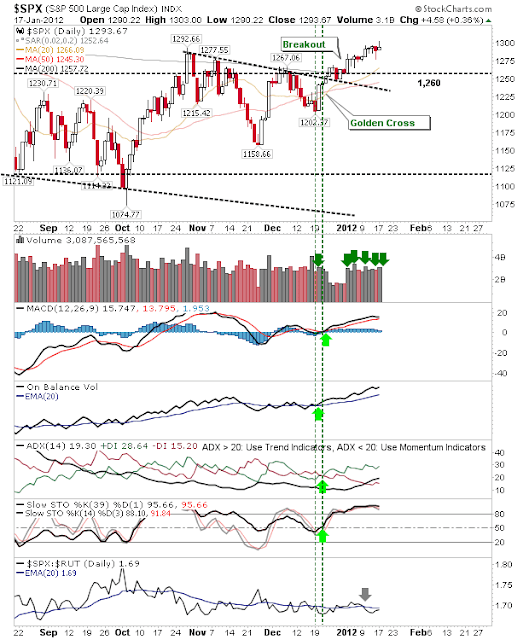
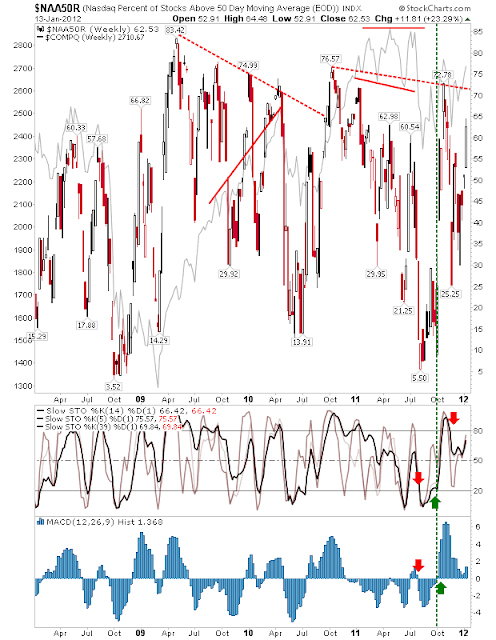
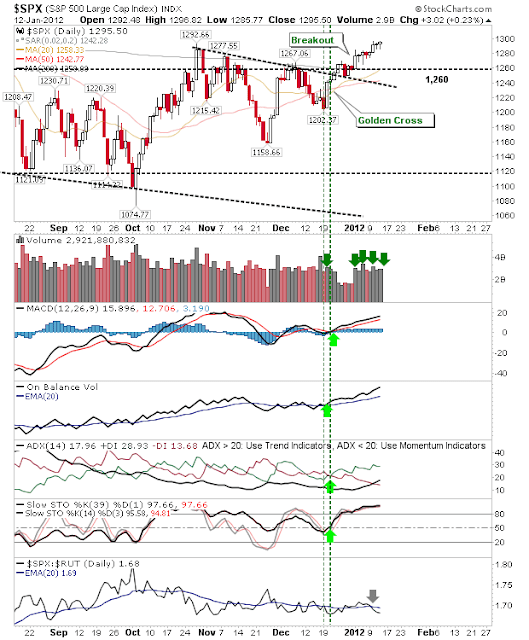
A little disappointing markets weren't able to push on after a strong start, but many indices registered accumulation days. The S&P finished near its October swing high, although it's in the process of turning this former resistance level into support. While stochastics are overbought, On-Balance-Volume and MACD continue to trend higher on the side of bulls. The Nasdaq retained some of its morning gap, but it's the shift in relative strength towards this index (from Large Caps / S&P) which is the most positive. Perhaps this rally is only just beginning? While the Nasdaq attracts interest from buyers, the Russell 2000 is losing some of its love (to the Nasdaq). However, the swing high breakout holds. The index to watch tomorrow is the semiconductor index.  With the Nasdaq performing well it will be important it can draw on strength in semiconductors. At the moment, the index is struggling at its 200-day MA. The rally keeps on moving higher until

Weekly Market Commentary: Market Breadth Improves; Breakouts for Dow and Russell 2000

Image
While indices continued their advance for the week, it was market breadth which made the biggest improvement. The Percentage of Nasdaq Stocks above the 50-day MA rose to 62%, leaving it on course to test resistance from late 2010, currently around 70%. The Nasdaq Bullish Percents also crossed the 50% halfway mark. Declining resistance for this index is around the 55% mark. The NYSE Summation Index also played its role. What had looked to be a 'bull trap' in October has turned into a new, shallower angled decline - a bullish development. A push above 750 will break this new resistance point. The Russell 2000 was one of the indices able to make a move as it cleared 760 resistance. The next challenge for the index is former neckline resistance at 780. The Dow also cleared resistance of its channel, albeit on a small gain. Volume climbed to register an accumulation week. Key for this week will be seeing the market breadth improvement convert to points on

Quick Update

Image
Currently in New Jersey on Zignals business so there will be limited updates until next weekend.  Suffice to say, little has changed since indices managed their breakouts. Buying volume has stayed reasonable, even if point gains have been meager. Bulls can take comfort in the swing into more speculative Small Caps from 'safety' issue Large Caps. Buying volume has been good in the Nasdaq as it too makes a relative strength gain against the S&P. The Russell 2000 has managed to break and hold above its 200-day MA. Another bright spot was the break of the 200-day MA in the semiconductor index as it looks to challenge 'bull trap' supply. This is good news for Tech indices. This rally continues to gain strength and take out supply.  A number of support levels are available with upticking 20-day MAs perhaps the most attractive 'buy-the-dip' area on the next move down.  Good Stuff (if you are a bull!). ----- Follow Me on Twitter Dr. De

Daily Market Commentary: Semiconductors Shine, S&P Primed

Image
How much further can the S&P pressure resistance without actually breaking resistance? The tight action over the past couple of days will unwind with a decent one-day move; to catch it, trade break of Monday's high/low with a stop on the flip side. The S&P (Large Caps) is clinging on to its out performance of the Russell 2000 (Small Caps). The semiconductor index enjoyed a strong day, starting with an opening gap and never looking back. It's caught in the no-mans land between its 50-day and 200-day MAs which makes it difficult to define the trend, although bulls are making a decent fist of it. Technicals bullish and improving - this suggests room for further upside. Unfortunately, strength in the semiconductor index didn't translate directly to the Nasdaq.  However, should semiconductors drive above its 200-day MA there will be additional support for continuation of a tech (Nasdaq and Nasdaq 100) rally.  The Nasdaq has the additional benefit of trading abo

Weekly Market Commentary: Dow and Russell 2000 Pressures Resistance

Image
I was digging through some old charts and came across this one (originally sourced from the now defunct headlinecharts.com); what it shows is the ordered relationship between yield (bonds), stocks and commodities. When markets make a bottom or top, first to change is Yields, then Stocks, and finally Commodities. In the 4-year business cycle, there is around a 12-month gap between a turn in Yield and Stocks, and around 9-months between Stocks and Commodities.  Yields in 30-year treasuries are fast approaching the swing low in 2008 - a potential support level. Stocks are already in rally mode, but assuming we are still waiting for a bottom in yields then the true bottom in Stocks may be a year away.  Commodities are still in decline, but calling a bottom will first require a confirmed low in Yields and a strong case for a bottom in Stocks.  For now, keep an eye on the 30-year treasuries for a bottom. As for the indices, the Russell 2000 is mounting a fresh challenge on 760 resistanc

Daily Market Commentary: Bulls Keep The Pressure On

Image
Buyers were again able to recover the intraday loss to finish higher. The Nasdaq enjoyed the best of the day's action, breaking above its 200-day MA on higher volume accumulation. Strength in the Nasdaq was helped by the continual improvement in market breadth; this time the Nasdaq Summation Index completed a net bullish turn in technicals. The semiconductor index climbed above its 50-day MA, lending additional support to the Nasdaq rally. And the rally in the Nasdaq 100. It too gained on higher volume accumulation. The Russell 2000 is preparing a fresh challenge on its 200-day MA. Today's intraday low came close to testing its 50-day MA, but the strong finish should see a test of the 200-day MA Friday. Thursday's strong finish is good news for bulls looking for more of the same. We have seen two consecutive intraday pullbacks, but buyers have been able to take the indices back to the day's highs; one of these days there will be no pullback - j

Daily Market Commentary: Yesterday's Gains Held

Image
Early losses were quickly recovered and markets were able to finish near yesterday's close. Yesterday's breakout gaps were tested, but not closed - although many indices started the day with a gap down; the pessimistic might view this scenario as a possible bearish island reversal.  But until the breakout gaps close the current scenario remains bullish and indices should push higher in the days ahead. The S&P is nicely placed with a Golden Cross between the 200-day and 50-day MA just a few days away. The Nasdaq is still pegged by the 200-day MA. Volume climbed to register a distribution day (although volume was no much higher than yesterdays). Bulls need to step it up here as shorts are better positioned to take advantage. Coming to the bulls defense is the breakout in the Percentage of Nasdaq Stocks above the 50-day MA. Technicals net bullish in this important breadth indicator. Small Caps did close its breakout gap, although rallied by end-of-day. It'

Archive

Show more