Posts

Daily Market Commentary: Strongest Market Experiences Weakest Volume

Image
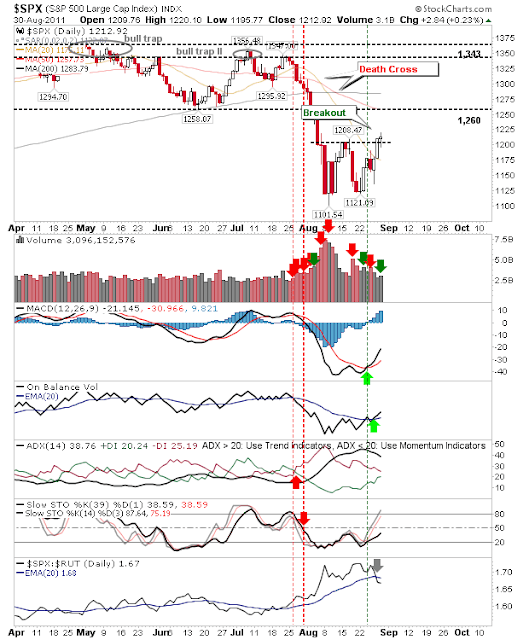
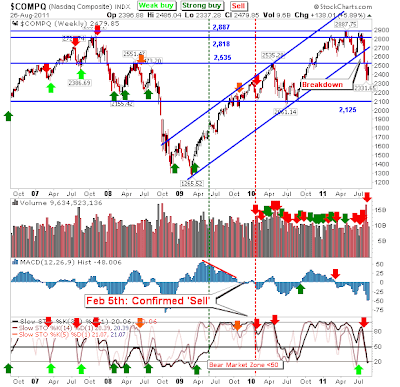
Today held similarities to the past couple of days; small gains on heavier volume. However, one index bucked the trend. The Nasdaq 100 is the first to test supply at the 50-day MA, but it was also the only index not to experience confirmed accumulation. This weakness may come back to haunt it if buyers run to the safety of Large Cap stocks. Nasdaq 100 Index ($NDX) via StockCharts.com The S&P still has some way to go to achieve the success of the Nasdaq 100 and despite enjoying an accumulation day it was unable to hold its early morning gain. The Nasdaq was caught in the middle. It made its initial test of 2,616 resistance, but on higher volume accumulation. Nasdaq Composite ($COMPQ) via StockCharts.com Finally, the Russell 2000 finished slightly down on the day, although it's breakout held. The issue for tomorrow is whether some of the late day uncertainty builds into a more concerted sell off. How will market breakouts hold when the selling does start? T

Daily Market Commentary: Modest Accumulation

Image
Yesterday's gains produced fine line breakouts which would have been easy to reverse on slight losses. But markets retained gains and Tech indices were able to put some distance from support, enough to offer some downside protection. The S&P was relatively quiet as buying focused around Tech and Small Caps.  The S&P finished the day with a small gain on higher volume accumulation. Yesterday's breakout remaining valid. The Nasdaq had the benefit of higher volume accumulation and a 0.5% gain. The index will soon be running into its first real test at 2,616 resistance. The Nasdaq 100 took the gains a step further, surpassing the trading range low and approaching the 50-day MA. Given the index had no problem regaining the trading range it's likely the Nasdaq will push above 2,616. How these indices perform at the 50-day MAs is the real question. Driving gains in the Nasdaq and Nasdaq 100 is the semiconductor index. Semiconductors gapped out of the narro

Daily Market Commentary: Small Caps Shine

Image
In one of the best days for the indices there was a strong push by buyers to snap up more speculative Small Cap and Tech stocks. All lead indices (S&P, Nasdaq and Russell 2000) left double-bottoms following neckline breaks. Challenges for the next few days will be holding breakouts and attracting money in from the sidelines. If there was a disappointment it was the lack of volume- although light upside volume from deep oversold conditions may actually be bullish (reflecting a skepticism on the merits of the advance).  The S&P was one of the first indices to generate a MACD trigger 'buy' with today seeing a 'buy' in on-balance-volume too. There was a relative strength shift away from Large Caps to Small Cap stocks. Next upside resistance is converged 1,260 and 50-day MA. Support can be found at today's double bottom neckline and the 20-day MA. S&P 500 Large Cap Index ($SPX) : via StockCharts.com The Nasdaq gapped past its 20-day MA and finishe

Weekly Market Commentary: Markets Oversold But In No-Mans Land

Image
Markets are caught in an unusual state. From the perspective of breadth they are still oversold, but on a support/resistance basis they are caught in a bit of a no-mans land (with the exception of the Nasdaq 100). The Nasdaq is oversold technically but not close to a weekly support zone to make it attractive to long term buyers, despite the defense of an early August swing low on the daily time frame. Weekly buying volume was light and below prior weekly selling. The Nasdaq 100 is best positioned to lead markets higher. A thick band of support runs from 2,130 up to 2,217, as marked by 2007 reaction highs. The index isn't yet oversold but it wouldn't take much selling to push it there. Where bulls hold the cards on the weekly time frame is in market breadth. Nasdaq Bullish Percents were little changed on the week but are well within market bottom territory. Even if a market bottom is not in play it's likely not far away (at least a decent trading low). The P

Daily Market Commentary: Dax Scare Triggers Selling

Image
The 4% in 15 minute plunge in the Dax sent ripples of concern through the market. The Dax recovered some of its losses by close of business but it's not immediately clear what the cause was. Indices had already rebounded off 20-day MAs before the bad news hit. Large Caps took the biggest hit with volume climbing to register as distribution across S&P and Dow. But tt wasn't all negative for these indices. The MACD triggered a 'buy', but on-balance-volume switched negative. There was also a 'buy' in the MACD of the Dow. The Russell 2000 didn't make a full test of its 20-day MA, but did see a MACD 'buy'. How will it react tomorrow? Finally, the Nasdaq suffered its own trouble with a bearish engulfing pattern. There was no MACD 'buy', although selling volume was lighter than in Large Caps. Ears will be on Bernake tomorrow. Expectation for a rally might prove to be too optimistic, but any strength is likely to see signif

Daily Market Commentary: Buying to Fill Gap?

Image
Buyers did well to step in and push the market higher after a weak Monday close. Volume climbed to register an accumulation day, although buying volume is below recent selling volume. There looks to be a drive to close the breakdown gap from last Thursday, so look for follow through upside in morning trading. What happens when these gaps close and/or 20-day MAs come into range remains to be seen. It was good to see Small Caps and Tech doing most of the front running. The Russell 2000 gained almost 5% on the day, but is still a long way from June lows (90 points away). Russell 2000 Small Cap Index ($RUT) via StockCharts.com The Nasdaq  isn't as far removed from the June low as the Russell 2000, but technicals remain weak. Watch for selling action at the 20-day MA, this may represent an either/or both combination of profit taking and new short sales (or bulls who purchased last week and are looking to get out). ($COMPQ) via StockCharts.com The S&P did not improve much

Weekly Market Commentary: Oversold But Not Oversold Enough...

Image
Markets took another step down. Volume dropped from the prior week, as Nasdaq, S&P and Russell 2000 stochastics reached the oversold mark. However, the week failed to end with a bullish candlestick, so there isn't a strong case for a market bottom (at least on the weekly time frame). With the loss of 2,535 the next level to aim for is a thick band of support at 2,125. The coming week may see this edge a little closer - very little for bulls here. Nasdaq : via StockCharts.com The Nasdaq 100 is also stuck in a bit of a no-mans land, although it still 'bear trap' if it was to close the week above 2,130. Nasdaq 100 Index ($NDX) via StockCharts.com The Nasdaq Bullish Percents saw a modest loss on the week, but the gap is glaring. Nasdaq Composite Bullish Percent Index ($BPCOMPQ) via StockCharts.com The Percentage of Nasdaq Stocks above the 50-day MA lingers below 10% for a second week. Shades of 2008 bottom - which wasn't the true market bottom. N

Archive

Show more