Posts

Daily Market Commentary: Close at High

Image
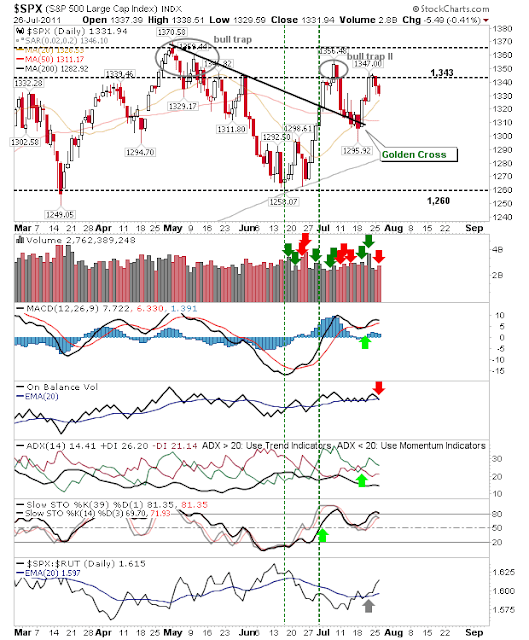
After the late morning drop it was going to be hard to get the 'bear traps' bulls were looking for. Although some markets performed better than others. The S&P finished right on the cusp of the 'bear trap' marker, although it did well to make up the 25 points it lost during the day. Volume climbed to register an accumulation day. There is still a good chance it will confirm the 'bear trap' tomorrow. ($SPX) via StockCharts.com The Nasdaq was more traditional in it found demand just before it touched on 2,616 support. Watch for supply as it makes a second pass on its 200-day MA. ($COMPQ) via StockCharts.com The Nasdaq 100 had the strongest day and it was the index best positioned for support. It comfortably held its 200-day MA (in the end) and fell just shy of closing above its 50-day MA. Technicals are still net bullish and has the least amount of overhead supply to consume. ($NDX) via StockCharts.com The semiconductor index posted over a 1

Daily Market Commentary: Ouch!

Image
Nowhere to hide... It was a mix of the bad and the worse. There were losses in support for the S&P, Russell 2000 and Semiconductor index. The rising channel and 200-day MA failed to hold for the Dow. While the Nasdaq lost its 200-day MA and turned net bearish. Best of the indices is still the Nasdaq 100. Technicals haven't fully reversed bearish and neither has the 200-day MA been tested - so there is workable support to aim for, slim though it may be. Today's losses were as bad as seen in other indices, but the larger picture still points to a trading range. As with most trading ranges, what happens at support and resistance carries greater weight than what happens in the middle. So today's action may not influence the Nasdaq 100 as much as it has in other indices. ($NDX) via StockCharts.com The Nasdaq took a harder hit than its sister index. It lost 200-day MA support and saw its technicals turn net bearish. However, it too trades within a range. So while toda

Daily Market Commentary: Volatile Spread

Image
I thought it would be a busy first half of the week and Monday didn't disappoint. Washington politics was overshadowed by weak ISM data which played havoc with my XLI position. The S&P turned net bearish as the index undercut but recovered the 200-day MA by the close of business. The index also said goodbye to declining former resistance as support. The index is looking more range bound with support at 1,260 and resistance at 1,343. ($SPX) via StockCharts.com A little more promising is the Dow. It closed Monday with an indecisive doji (not normally a positive), but it was able to finish on channel suport. Technicals are net negative, but it does have the 200-day MA to look too. ($INDU) via StockCharts.com The Nasdaq didn't suffer to the same degree as the S&P. Technicals are clinging on and it still has declining resistance to lean on (not to mention the 200-day MA). ($COMPQ) via StockCharts.com Semiconductors took another step down. Enough to negate the

Weekly Market Commentary: Russell 2000 and S&P Under Pressure

Image
A bad week for markets, overshadowed by Washington politics, pulled indices closer to support. Looking at weekly charts it's not hard to see the reason for the selling, especially for the 'smarrt' money holding from 2009 looking to take profits, or buyers in 2011 who have seen their positions meander around with little to show for it. The strongest index before the week started was also the index to suffer least by the selling. The Nasdaq 100 may have reversed last week's breakout, leaving behind a potential 'bull trap', but it's still the index best positioned to lead should there be any semblance of buying interest. ($NDX) via StockCharts.com Strength in the Nasdaq 100 has a positive knock on effect on the Nasdaq, despite the latter index shedding over 5% on the week. The index also hasn't cracked above 2,887 resistance, but remains well positioned inside the bullish channel. Nasdaq via StockCharts.com Unfortunately, the Russell 2000 pulled

Daily Market Commentary: Afternoon Selloff

Image
Markets tried to make inroads into yesterday's losses, but sellers emerged into the last hour of trading to whip the gains away and then some. However, Markets aren't entirely without relief. The S&P is leaning against declining former-resistance-turned support. Volume, while heavy, was below yesterday's distribution. Technicals didn't improve and stochastics are close to leaving the technical picture net bearish. But there is reason for optimism. ($SPX) via StockCharts.com The Nasdaq fared a little better given it finished just above 50-day MA support. Thursday's doji at yesterday's lows defines the buyer and seller battle. Friday offers another opportunity for bulls to mount a rally. Whether it can challenge the three bull traps remains to be seen. ($COMPQ) via StockCharts.com Finally, Small Caps offer their own hope with a 200-day MA defense. Despite the heavy losses the index is not oversold on an intermediate time frame, but there is probably

Daily Market Commentary: Nasdaq 100 Bull Trap

Image
It was a bad day all round for the indices, but the real loser was the Nasdaq 100. The Nasdaq 100 was the market leader, breaking to a new multi-year high and offering a platform for other indices to follow suit. Unfortunately, todays' selling left a sizable bull trap with a 'sell' trigger in the +DI/-DI. The Nasdaq 100 finished at its 20-day MA, but no other index has found support here. Significant distribution suggests selling will continue down to its 50-day MA. ($NDX) via StockCharts.com The Nasdaq suffered three 'sell' triggers in its technicals; MACD, OBV and +DI/-DI. It also bull trapped for the third time. Not to mention the clean loss of 20-day MA support. Have I left anything out? Bad day for Tech. ($COMPQ) via StockCharts.com The S&P got hit with multiple bearish turns; higher volume distribution, a clean loss of 20-d and 50-d MA support, and 'sell' triggers in MACD and on-balance-volume.The 200-day MA is next support level. ($SP

Daily Market Commentary: Semiconductors at 50-day MA Resistance

Image
Bears were able to turn up the heat after a lackluster Monday. Volume climbed as sellers pressured markets towards their 20-day MAs, marking confirmed distribution. The S&P didn't quite make it down to its 20-day MA, but it did suffer a 'sell' trigger in on-balance-volume. A confirmed test of the 20-day MA is likely Wednesday. The Nasdaq finished with an inside day of an inside day. Trade break of 2,851 / 2,832 with a stop on the flip side. Technicals still net green but index trading inside 'bull trap' supply zone. Can it break higher? The Nasdaq Summation Index is given an indication an intermediate top is in place. The clincher is the 'sell' trigger in the ratio between this index and the Bullish Percents. Will this be the catalyst for the next sell off (will Tuesday's inside day gap down)? The Russell 2000 continues to break down. It was unable to hold 20-day MA support. Technicals poor and getting poorer. But the index whic

Archive

Show more