Posts

Daily Market Commentary: Prior 'Bull Traps' Hold

Image
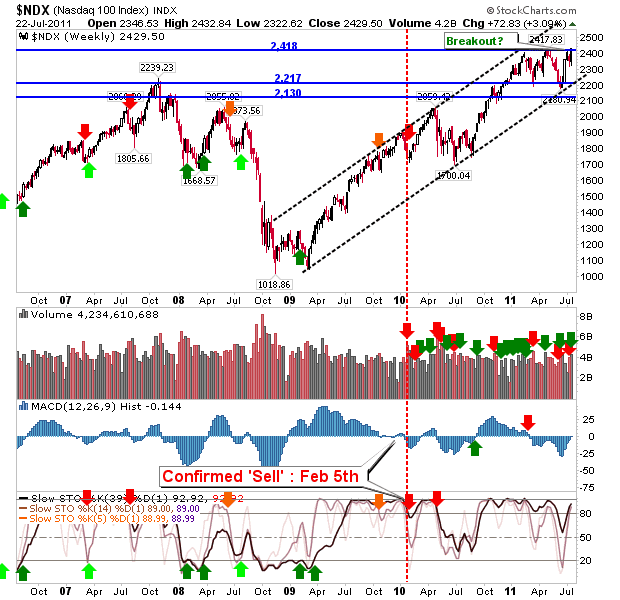
The failure of politicians to agree a Federal Debt Plan prevented certain markets (chiefly Nasdaq and Russell 2000) from pushing into the fresh air of no overhead resistance. Despite this, Monday's selling was not hugely problematic, nor heavy. The S&P eased back from quite stubborn resistance at 1,343; technicals held net positive. For tomorrow, look for test of fast approaching 20-day MA. Which will break first? 20-day MA support or 1,343 resistance. The Nasdaq was pegged back to 2,836 support but remains stuck in the 'bull trap' zone. The 20-day MA lurks at 2,800 to offer a second tier of support. But with the Nasdaq 100 holding its breakout despite today's losses it will be important for the Nasdaq to pressure 2,884 resistance. And the challenge for the Nasdaq 100 is clear - maintain the breakout. While the Russell 2000 is losing some steam as it struggles to clear the broad trading range. Holding the 20-day MA is an important starting point and that

Weekly Market Commentary: Nasdaq 100 Breakout

Image
The week finished with a fresh breakout for the Nasdaq 100. This index continues to reward bulls since taking out its 2007 high. Technicals remain good and the index has enjoyed heavier volume accumulation dating back to October 2010. No reason to doubt the momentum. While the Nasdaq 100 leads the way, the Nasdaq is poised to follow. The Nasdaq chart looks good as it trades well inside the trend channel, so it has room to move sideways as overhead supply is consumed. The Russell 2000 hasn't pushed enough to take out the 'bull trap'. But like the Nasdaq, it is well inside its rising channel and is lurking near resistance. With speculative money favouring tech stocks it may yet see some trickle down benefit ahead of the S&P The S&P is also in a position to take out the nearest swing high, but it's a long way from the 2007 high which other indces are challenging - or have already beaten. The main points of concern for both the Nasdaq and S&P

Daily Market Commentary: Heavy Volume Gains

Image
The perfect follow through to Tuesday's buying (and yesterday's tight trading). Trading volume was comparable to that of the June bottom. Friday will look for another consolidation now resistance is more of a factor (for certain indices). The S&P finished on 1,343 resistance which marked the line in the sand for the May and July bull traps. Technicals remain net bullish.  The recent 'Golden Cross' lends support for a continuation of the intermediate term rally. ($SPX) via StockCharts.com The Nasdaq did not enjoy as strong buying Thursday, although it had already reached bull trap resistance on Tuesday's trading. Like the S&P, technicals are net bullish and a 'Golden Cross' is in play. ($COMPQ) via StockCharts.com The index to watch is the Nasdaq 100. It has no 'bull trap' to negate, just old fashioned resistance. A break here will help other indices do likewise - the Nasdaq in particular. ($NDX) via StockCharts.com The othe

Daily Market Commentary: Stays Near Tuesday's Highs

Image
Bulls can be reasonably satisfied with Wednesday's action. Sellers made a not unexpected appearance, but were unable to push markets lower or scare buyers out of their positions. Selling volume was below Tuesday's buying. The Nasdaq and Nasdaq 100 finished the day slightly worse off, only because gap open (triggered by Apple's incredible earnings) had sold off by the end of day. The S&P held Tuesday's highs with tight trading. A break of high/lows will offer a swing trade opportunity (stop on flip side) with the likelihood of an upside break perhaps preferred. The Russell 2000 traded a little wider on the intraday range, but still did enough to suggest bulls hold the edge. My sector breadth study has the S&P at a reading of 48% bullishness which is as close to neutral as possible. Whatever direction the S&P goes tomorrow will likely dictate the trend for the next 5-10 days. Follow Me on Twitter Dr. Declan Fallon is the Senior Market Technici

Daily Market Commenary: Bulls Rally

Image
Buyers were prepared to come in from the sidelines, doing so with heavier volume accumulation. Bull traps remain an overhead supply concern. The Nasdaq is the index most likely to challenge this supply first (possibly tomorrow). The real winner was the semiconductor index. It was able to recover with a bear trap, regaining 388 support. It's first level of supply to overcome is its 20-day MA at 401.61, before the 50-day MA comes into range. The Nasdaq reversed the technical 'sell' triggers in the MACD and ADX and is less than 10 points away from challenging bull traps marked at 2,836 resistance. The reversal in the semiconductor index will help the Nasdaq going forward. The S&P was able to recover from the 20-day MA, but has more room to maneuver higher before it can start challenging the bull traps. Finally, the Russell 2000 rallied from declining resistance-turned-support, gaining over 2%. But like the S&P it will require a few more positive days b

Daily Market Commentary: Aggressive Buy?

Image
Markets took another big hit but were able to recover some of the losses by the days close. Many of the lead indices are toying with converged support of 20-day MA, 50-day MA and declining trendlines or combinations thereof. The semiconductor index suffered the indignity of a loss of the June swing low, but also a 'Death Cross' between 50-day and 200-day MAs. However, technicals are oversold and if the index was able to close above 390 it would give credence for a bear trap and offer a good bounce play as far as the 50-day MA for starters. Semiconductor Index - Philadelphia ($SOX) via StockCharts.com If semiconductors are able to dig in at this point then it will help the Nasdaq (and Nasdaq 100) defend current support, namely converged 50-day and 20-day MAs plus declining trendline. However, there were 'sell' triggers for the MACD and between +DI/-DI - but these may be short lived signals. ($COMPQ) via StockCharts.com The S&P suffered heavier selling than

Semiconductors Break June Swing Lows

Image
More to come later, but the trouble for the Nasdaq and Nasdaq 100 is the loss of June swing lows as support for the Semiconductor index. It could still make it back by the close, but it will need a late day rally to save the day. Will buyers step in here? Semiconductor Index - Philadelphia ($SOX) via StockCharts.com Follow Me on Twitter Dr. Declan Fallon is the Senior Market Technician and Community Director for Zignals.com . I offer a range of stock trading strategies for global markets which can be Previewed for Free with delayed trade signals. You can also view the top-10 best trading strategies for the US, UK, Europe and Rest-of-the-World in the Zignals Trading Strategy Leaderboard . The Leaderboard also supports advanced search capability so you can tailor your strategies to suit your individual requirements. Zignals offers a full suite of FREE financial services including price and fundamental stock alerts , stock charts for Indian, Australian, Frankfurt, Euronext, U

Archive

Show more