Posts

Weekly Review of Stockcharters: Markets Defy Opinion

Image
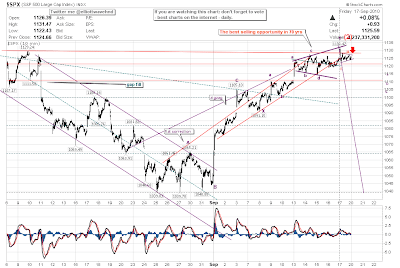
Friday's flourish gave the week a bullish filip. What had the Stockchart.comers have to say about it. Anthony D Allyn of Elliotwavehound.blogspot.com offers his outlook: I'm a seller of this market. We are way over-bought here. It's only left over emotional energy from wave E/2 holding this market up now, so It's best to head for the exits before wave 3 starts. The easy money is finally about to be made on the short side, and no amount of manipulation can prevent it. The media campaign... to change investor sentiment has failed miserably. Will this double top (on the 10-minute) come to fruition? Monday's the day... Friday's gains were viewed as a throw-over. Richard Lehman of the Channelist had said, before Friday, this: 9/23 -- Looks as if the broad market is finally rolling over, but cannot quite draw new downchannels yet. Hopefully will have enough data to draw minichannels on Friday. 9/21 -- Today's lift made things verrrrrry toppy. T

Weekly Market Commentary: S&P Breakout follows Nasdaq/Nasdaq 100 Breakouts

Image
Friday's strong finish didn't just add another notch to the rally it also helped mark new breakouts on the weekly timeframe. The S&P saw a clear resistance break of its triangle, although volume was somewhat lacking. ($SPX) via StockCharts.com Last week the Nasdaq cleared downward channel resistance. This week it cleared summer resistance. Nasdaq via StockCharts.com The Nasdaq 100 is putting pressure on the May bull trap. The index is very close to erasing all of the credit crisis losses. ($NDX) via StockCharts.com Nasdaq Breadth is also showing bullish form with a W-bottom in the Bullish Percents. This is the only Nasdaq and S&P breadth indicator I follow which is not on a technical 'buy' signal. Looks ready to reverse this very soon. ($BPCOMPQ) via StockCharts.com With the Percentage of Nasdaq Stocks above the 50-day MA fast approaching declining resistance. ($NAA50R) via StockCharts.com Small Caps weren't left out of the party and conf

Daily Market Commentary: Harder Losses

Image
Indices took another hit and are trading at or below Monday's low. On the bright side, selling volume was not very high. The S&P left what may evolve into a bull trap. The rising channel line has been breached, but a horizontal support line connecting June/August reaction highs is holding. ($SPX) via StockCharts.com The Russell 2000 came back to its 200-day MA but there was a worrying push to new lows in relative strength to the Nasdaq; suggests there is more downside in the tanks. ($RUT) via StockCharts.com However, this time the semiconductor index may help. It challenged its 50-day MA for a second time and is well positioned to break higher tomorrow. ($SOX) via StockCharts.com The semiconductor index may help the indices tomorrow but the selling has the look of lasting another day. But it's not plain sailing for bears; there is workable support and a bullish engulfing pattern could emerge given the general timid selling volume today. Follow Me on Twitter

Daily Market Commentary: Could Have Been Worse

Image
By early afternoon it was looking all rather shaky for bulls, particularly for Small Caps (Russell 2000), but in the end the rot never set and markets held their ground. Loses were relatively minor but there was confirmed distribution for the Nasdaq and Nasdaq 100. However, even the losses in the Nasdaq were less worrisome given the 'Golden Cross' between 20-day and 50-day MAs. ($COMPQ) via StockCharts.com Losses in the S&P didn't break former channel resistance turned support. ($SPX) via StockCharts.com And while it was looking bad for the Russell 2000 it was able to hold the 200-day MA with a 'Golden Cross' between 20-day and 50-day MAs. However, there was a 'sell' trigger in the CCI and 672 is looking firm resistance. ($RUT) via StockCharts.com Once again, semiconductors were left in the worst state. The days' modest losses were enough to leave a potential bull trap behind - although in reality it's more likely to morph into a new

Daily Market Commentary: Holds Station

Image
Markets had reacted positively to Fed news to continue with their easing policy with the expectation of a rate hike in December 2011 . However, early enthusiasm gave way to late afternoon selling which leaves markets vulnerable to some follow through downside on Wednesday. The S&P closed down slightly but remained in the upper part of yesterday's trading range ($SPX) via StockCharts.com Small Caps tagged resistance but nothing more ($RUT) via StockCharts.com Just as the semiconductor index brushed its 50-day MA: ($SOX) via StockCharts.com Likely opening weakness (a gap down) sets up the possibility for a whole day of selling. Should this happen bulls probably have an hour in the morning to stabilize things but it could be hard for them to build momentum even if this is managed. Todays' trading was too wide for a swing trade tomorrow - an inside day would offer a better opportunity. I suspect tomorrow will see an absence of buyers rather than any concerted sell

Daily Market Commentary: 2,000 post!

Image
After 5 years of blogging (9 year presence on the web) I have finally hit the 2,000 post mark. Markets weren't prepared to listen to my opinions and rallied for yet another day - negating the bearish black candlesticks from Friday. If there was a concern it was the general lack of volume. The S&P cracked out of its mild rising channel, creating the potential for a new - stronger - bull trend. ($SPX) via StockCharts.com The Nasdaq is on course to create an initial 'Golden Cross' between its 50-day and 20-day MAs. ($COMPQ) via StockCharts.com Small Caps added nearly 3% but still remain range bound. However, it has pulled away from its 200-day MA. ($RUT) via StockCharts.com The Nasdaq 100 is well past its trading range and has a 50 point gap to play with when it comes to back-testing resistance-turned-support of the former range. ($NDX) via StockCharts.com The only let down was the narrow range in the semiconductor index. Watch how it reacts around the 50

Weekly Review of Stockcharts.com Charts; All Hands on Deck?

Image
Markets were left with isolated black candlesticks on Friday after a series of gains - usually a sign of a top. How did the Stockcharters view this? Anthony D Allyn of Elliotwavehound.blogspot.com has an unusual comment on his 10-min S&P chart; not sure I would say it was the "best selling opportunity in 70 yrs" - maybe 70 minutes! His 60-min S&P chart is no less forgiving The Dow (daily) is similarly poised at a potential pivot reversal Anthony Caldaro of Objectiveelliotwave is looking at a final fifth wave high on the 60-min S&P chart before the ABC correction commences He has a Nasdaq bear target of 1937-1942 Richard Lehman of the Channelist.com notes a loss of bullish momentum, but that things still point upwards (for now) 9/16 -- Everything remains in green ST upchannels, though most charts indicate slope changes now. That means loss of momentum, but still heading up. A few things (QQQQ for example) are hitting upper lines on long ter

Archive

Show more