Friday's flourish gave the week a bullish filip. What had the Stockchart.comers have to say about it.
Anthony D Allyn of
Elliotwavehound.blogspot.com offers his outlook:
I'm a seller of this market. We are way over-bought here. It's only left over emotional energy from wave E/2 holding this market up now, so It's best to head for the exits before wave 3 starts. The easy money is finally about to be made on the short side, and no amount of manipulation can prevent it. The media campaign... to change investor sentiment has failed miserably.
Will this double top (on the 10-minute) come to fruition? Monday's the day...
Friday's gains were viewed as a throw-over.
Richard Lehman of the
Channelist had said, before Friday, this:
9/23 -- Looks as if the broad market is finally rolling over, but cannot quite draw new downchannels yet. Hopefully will have enough data to draw minichannels on Friday.
9/21 -- Today's lift made things verrrrrry toppy. The fact that recession officically ended many months ago may reduce the fear of big decline (for the moment), but is no reason to send things into the stratosphere. Many charts are now at upper lines on the long term charts.
9/20 -- The likely last leg of this upmove is now playing out. Long term charts are about to hit numerous upper channel lines and are already at stochastic extremes. (some aggressive charts like QQQQ are actually above upper LT channel lines, but most are just now approaching them.) Larger green ST upchannels have now been drawn. And we're supposed to get bullish now that the NBER says we end the recession a year ago June -- oh puhleese :)
9/20 -am- Short term upchannels are still intact, but long term action is getting very toppy. I'd be alert to a little more upward action this week, but the growing likelihood of a 5+% decline into October. Watch for the breaks on the ST green channels. Be careful with those gold mining stocks.
9/16 -- Everything remains in green ST upchannels, though most charts indicate slope changes now. That means loss of momentum, but still heading up. A few things (QQQQ for example) are hitting upper lines on long term charts, others still have room on the upside before hitting a channel line of some sort.
Note 'Sell' signal:
Yong Pan of
Cobrasmarketview. His weekly view offers the same weekly neutral summary as last week - despite the buying.
But his automated strategy is on a long signal.
And there is also the head-and-shoulder (bullish) breakout for the S&P
Michael Eckert of
EWTrendsandcharts offers a top for the S&P at 1,158
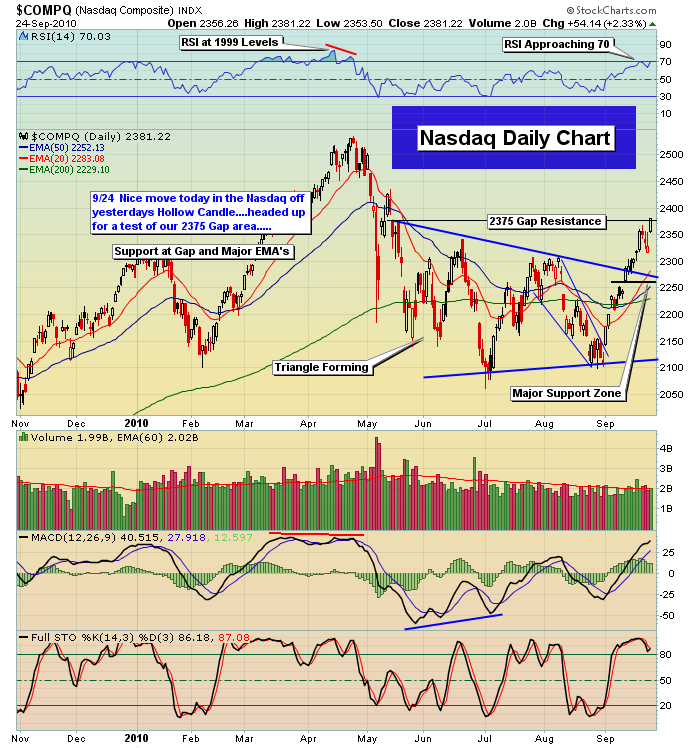
Robert New of
TheInformedTrader.com is looking at Gap resistance in the Nasdaq c 2,375.
With wedge breakouts on the weekly timeframes:
So, it's a mixed bag with opinion favouring a collapse while markets point towards continued gains. How will Monday set the tone?
Follow Me on Twitter
Build a Trading Strategy Business in Zignals
Dr. Declan Fallon, Senior Market Technician for
Zignals.com, offers a range of stock
trading strategies for global markets, also available through the latest rich internet application for finance, the
Zignals MarketPortal or the Zignals
Trading Strategy MarketPlace.
Zignals offers a full suite of financial services including price and fundamental
stock alerts,
stock charts for Indian, Australian, Frankfurt, Euronext, UK, Ireland and Canadian stocks, tabbed
stock quote watchlists, multi-currency
portfolio manager, active
stock screener with fundamental trading strategy support and
trading system builder. Forex, precious metal and energy commodities too. Build your own
trading system and sell your
trading strategy in our MarketPlace to earn real cash. Read what others are saying about Zignals on
Investimonials.com.
JOIN US TODAY - IT'S FREE!