Posts

Daily Market Commentary: Tech Raises Questions

Image
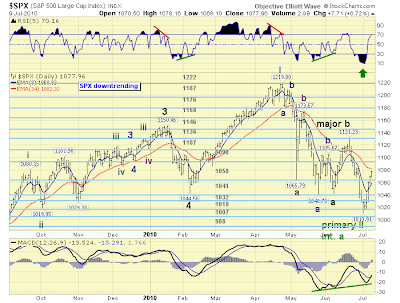
It was a tricky day for markets. On the positive side, Large Caps held their channel breakouts and are nicely positioned to build on yesterday's gains; volume eased in line with a bullish consolidation. ($SPX) via StockCharts.com On the more mixed side were the Nasdaq and Nasdaq 100, in each case there is indecision at converged 50-day and 200-day MAs but the Nasdaq is also up against declining channel resistance. Technicals of each have turned net bullish so there is momentum to drive a break. ($COMPQ) via StockCharts.com The hardest hit was the semiconductor index. After a strong day yesterday, today it finished with bearish cloud cover. Not the ideal scenario to help drive Tech averages higher. ($SOX) via StockCharts.com For Wednesday keep an eye on the Nasdaq and watch for upside follow through in the S&P and Dow. Technicals suggest there is more upside in the tank but markets remain vulnerable with the sequence of lower highs and lower lows intact. Follow Me

Stock to Watch: Rubicon Technology (RBCN)

Image
Bulls will be looking to press yesterday's advantage off the back of strong Intel earnings so this optimism should spread to other technology stocks. I had to dig through my past breakout scan results to come up with a stock for today. Today's candidate, Rubicon Technology ( RBCN ) - a specialized semiconductor company, featured on June 14th and could see some love over the coming days. Unlike many of the breakout stocks which have featured this past month it was one of the few not to reverse the qualifying (June 14th) breakout. The stock is engaged in a strong up trend dating back to market lows of March 2009, less the negative consequences of the past 3 months. It is nicely poised to break $34 resistance; a tight stop could go on a loss of $32, but if you wanted to give the trade some room place the escape hatch on a loss of $30. As for upside potential, the 1-year Analysts' estimate is $35.83. Five analysts have 'buy' rating, one an 'outperform' a

Daily Market Commentary: Bear Channels Break For Large Caps

Image
The tension of the past couple of days released to the upside which kept momentum with bulls. Volume was mixed which undermined the extent of the gains for some of the indices, but there was substantial technical improvement - particularly for large cap indices. The S&P cracked above the declining channel and finished on the 50-day MA. Technicals are net bullish which was last achieved in February so it's a significant improvement on activity for recent months. ($SPX) via StockCharts.com The Dow was similarly impressive, going one step better to finish on its 200-day MA having started the day at its 50-day MA. With technicals net bullish and all key moving averages cleared it is the most bullish of the lead indices. AAAAAAAAE Dow Jones Industrial Average ($INDU) via StockCharts.com The index to watch tomorrow is the Nasdaq; today finished at converged 200-day and 50-day MAs with a 'Death Cross' imminent. However, it also registered an accumulation day. Unlike

Stock to Watch: Merge Tech (MRGE)

Image
Another stock from the June 25th collection of breakouts , Merge Technology ( MRGE ). On June 25th the stock emerged from a triple bottom (with a $2.81 neckline) on strong volume. It followed with a 'bull flag' that held support between $2.88 and $2.93. The 'bull flag' broke last week although Monday saw prices retreat back to $3.04 from $3.21 - but didn't drop far enough to invalidate the 'bull flag'. Whether buyers will be willing to bid MRGE up should the broader market ease back after a series of tightening gains remains to be seen. The 'bull flag' low of $2.88 would need to hold to maintain the momentum of the two month rally from $2.00. As for upside potential, the breakdown gap from last November is a useful starting point. I have offered a Trading Idea for a push to $3.49 with a stop at $2.88; alternatively - a Zignals Stock Alert can be set for a price cross of each. Analysts have a 1-year consensus target of $3.60 with two '

Daily Market Commentary: Bulls Do The Bare Minimum

Image
Bulls did what they had to do to register a higher close, but did little to challenge the prevailing down trend. The S&P saw a close over its 20-day MA with Friday producing a MACD trigger 'buy', with on-balance-volume and intermediate-term stochastics close to 'buy' triggers too. The tight "coiling" action of the past couple of days will unwind soon. Should the unwind push prices higher there is a good chance the downward price channel from April will break as part of the unwind. ($SPX) via StockCharts.com The Nasdaq closed below its 20-day MA but had a MACD and on-balance-volume 'buy' trigger. Volume rose to register a modest accumulation day - but really, overall volume remained light. ($COMPQ) via StockCharts.com Small Caps created a 'bear trap' with Friday's higher close but remains troubled by 20-day (and likely 200-day) MAs overhead. However, Monday's losses weren't enough to question the validity of the 'be

Stock to Watch: Tibco Software

Image
The prognosis for stocks today is not good so its likely we will see better - low risk - buying opportunities over the coming days. The past couple of weeks have not been kind to momentum driven stocks and I have to go back to Friday, June 25th to find the last time my breakout scan produced potential candidates in numbers. June 25th was an odd day for markets as indices traded with indecision for the most part. Only the Russell 2000 was able to mount a defense of its 200-day MA while other indices were still coming to terms with breaks in theirs. So for the scan to turn up 31 candidates back then was a bit of a shock. Unfortunately, the vast majority of these breakout stocks suffered as traders sold into strength as markets continued their downward descent. But one, Tibco Software ( TIBX ), has managed to go one better by posting a higher close Friday (and a price higher than the one which qualified it as a breakout in the first place). The stock emerged last week from a tra

Weekly review of Stockchart.com charts

Image
It was a week where bulls got some of their mojo back. What had chart commentators to say about it? Anthony Caldaro of Objectiveellitotwave suggests the bounce is the start of a third wave higher - this is very bullish because it would mean a break of the bear flag highs which is marking channel resistance for the downtrend. Richard Lehman of Channelist.com is waiting for tests of larger channel resistance once the smaller up channels currently in play comes into contact. 7/11 -- The broad indexes continue in somewhat steep short term blue minichannels. These minis have brought most items at least midway back up through the purple long term downchannels on the daily/one-year charts. The blue minis will likely encounter big resistance from those purple lines, and that could happen this week (for SPY that is around 110). A reversal there has big potential downside, whereas a penetration will signal an end to the correction since April. In this weekend's newsletter (now

Archive

Show more