It was a week where bulls got some of their mojo back. What had chart commentators to say about it?
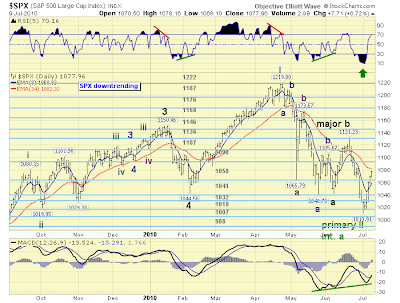
Anthony Caldaro of
Objectiveellitotwave suggests the bounce is the start of a third wave higher - this is very bullish because it would mean a break of the
bear flag highs which is marking channel resistance for the downtrend.
Richard Lehman of
Channelist.com is waiting for tests of larger channel resistance once the smaller up channels currently in play comes into contact.
7/11 -- The broad indexes continue in somewhat steep short term blue minichannels. These minis have brought most items at least midway back up through the purple long term downchannels on the daily/one-year charts. The blue minis will likely encounter big resistance from those purple lines, and that could happen this week (for SPY that is around 110). A reversal there has big potential downside, whereas a penetration will signal an end to the correction since April.
In this weekend's newsletter (now by subscription), I discuss last week's action, explore two alternative longer term scenarios, point out trading opportunities, and provide 36 other detailed charts on sectors, countries, etc.) For info, please visit WWW.CHANNELIST.COM
7/8 -- First, I replaced the Dollar Index with two UUP charts, since they update intraday.
Short term blue minis continued upward today. They could end at any time, but the important question on everyone's mind now is could something this strong still be just a bear market bounce, or can we assume the correction is over and a new upleg has begun?
The long term purple channels still face downward. So while it is possible that this upleg can continue, it will ultimately have to test resistance from the upper purples, and will require a breakout at that point to confirm that the purples have ended. Until then, the power of that purple should be respected.
The stochastics on the one-year charts did now reach extremes and are curling up. That supports a bullish case here, but by itself, that is no gurantee we've hit bottom. If you look at the March stochastics, they hit extremes and gave two false crosses while the markets continued skyward.
Interesting bear scenario on the Dow Daily:
Yong Pan of
Cobrasmarketview is still going for mostly neutral market conditions with bearish signals on the rise
His automated strategy stopped out with a loss.
10-year yields work a bottom (and bear trap?)
Michael Eckert offers a conflicting wave count - suggesting a 3rd wave target (down) of 843 for the S&P (unless I am misreading the earlier chart of Caldaro??? Either way - bear flag highs aka '2' on the chart below is the key battle zone)
Joe Reed points to how last week was the best in a year (really??).
Dow and S&P finds support at 38.2% Fib retracement after rally reversed from 61.8%; how will rally progress from here - will these boundaries mark a trading range for the remainder of the year?
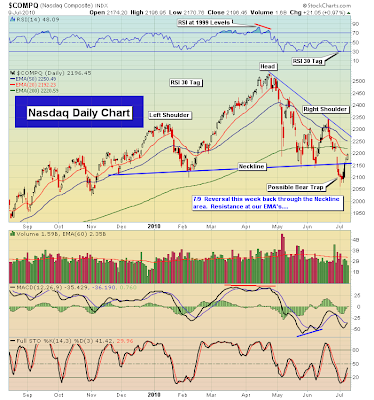
Robert New is looking at last week's rally has a bear trap to the head-and-shoulder break.
His focus is on 50 and 70-day EMAs - which have so far played as support in the Russell 2000.
Finally,
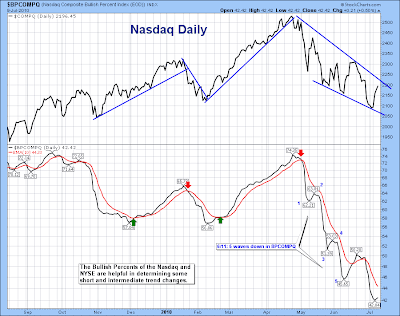
Matthew Frailey of
Breakpointtrades has a chart which uses the inflections in the Nasdaq Bullish Percents to mark wave counts; so has the ABC correction almost complete?
In summary, a bit of a mixed bag; opinion still favours the rally of last week running out of steam but I think the 'bear trap' left by last week could offer a surprise - particularly for a push above the bear flag highs.
Follow Me on Twitter
Build a Trading Strategy Business in Zignals
Dr. Declan Fallon, Senior Market Technician for
Zignals.com, offers a range of stock
trading strategies for global markets, also available through the latest rich internet application for finance, the
Zignals MarketPortal or the Zignals
Trading Strategy MarketPlace.
Zignals offers a full suite of financial services including price and fundamental
stock alerts,
stock charts for Indian, Australian, Frankfurt, Euronext, UK, Ireland and Canadian stocks, tabbed
stock quote watchlists, multi-currency
portfolio manager, active
stock screener with fundamental trading strategy support and
trading system builder. Forex, precious metal and energy commodities too. Build your own
trading system and sell your
trading strategy in our MarketPlace to earn real cash. Read what others are saying about Zignals on
Investimonials.com.
JOIN US TODAY - IT'S FREE!


