Posts

Stock to Watch: Tibco Software

Image
The prognosis for stocks today is not good so its likely we will see better - low risk - buying opportunities over the coming days. The past couple of weeks have not been kind to momentum driven stocks and I have to go back to Friday, June 25th to find the last time my breakout scan produced potential candidates in numbers. June 25th was an odd day for markets as indices traded with indecision for the most part. Only the Russell 2000 was able to mount a defense of its 200-day MA while other indices were still coming to terms with breaks in theirs. So for the scan to turn up 31 candidates back then was a bit of a shock. Unfortunately, the vast majority of these breakout stocks suffered as traders sold into strength as markets continued their downward descent. But one, Tibco Software ( TIBX ), has managed to go one better by posting a higher close Friday (and a price higher than the one which qualified it as a breakout in the first place). The stock emerged last week from a tra

Weekly review of Stockchart.com charts

Image
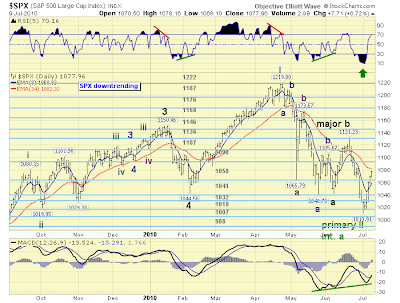
It was a week where bulls got some of their mojo back. What had chart commentators to say about it? Anthony Caldaro of Objectiveellitotwave suggests the bounce is the start of a third wave higher - this is very bullish because it would mean a break of the bear flag highs which is marking channel resistance for the downtrend. Richard Lehman of Channelist.com is waiting for tests of larger channel resistance once the smaller up channels currently in play comes into contact. 7/11 -- The broad indexes continue in somewhat steep short term blue minichannels. These minis have brought most items at least midway back up through the purple long term downchannels on the daily/one-year charts. The blue minis will likely encounter big resistance from those purple lines, and that could happen this week (for SPY that is around 110). A reversal there has big potential downside, whereas a penetration will signal an end to the correction since April. In this weekend's newsletter (now

Weekly Market Commentary: Inside Week

Image
After the prior week bear flag break this week recovered some of the losses to close with an inside week. It doesn't negate the bearishness of the bear flag break but the recovery gives bulls an edge into next week (and earnings season). The S&P edged over the (bearish) head-and-shoulder neckline and if it can crack above the bear flag highs might give shorts something to worry about. On the flip side, stochastics are in no-mans land and the MACD is a long way from turning bullish. Bears will probably wait for bulls to run out of steam before getting aggressive again; look for a low volume rally next week. ($SPX) via StockCharts.com Not much different for the Nasdaq with the exception the index has yet to break below long standing support of 2,020. If bulls had a wish it would probably be for a trading range between 2,020 and 2,535 given the 2009/10 rally just can't keep going up forever. Nasdaq via StockCharts.com The Nasdaq 100 is playing off a support line dat

Stock to Watch: Satcon Technology Corp (SATC)

Image
With Futures suggesting a mixed Friday in preperation for next week's earnings season and last night's breakout scan drawing a blank I took a look at previous breakout candidates to find a stock which is behaving well. One which caught the eye was Satcon Technology Corp, SATC . The stock featured twice in a past breakout scan; first on June 25th and again on June 28th when it closed at $2.99 and $3.08 respectively. The stock has since converged into a bullish wedge which has held above prior trading range resistance of $2.90 (it closed yesterday at $2.90). The top-end of the 2010 range is $2.93 but if the stock is to push on it will have to make its move over the next couple of days. A confirmed move higher will require a close above $3.00 on volume, otherwise a close below $2.75 would negate the bullish implications of the wedge pattern. Analysts have placed a 1-year price estimate of $3.71 with two recommending a 'buy' and three a 'hold'. MDB Capital G

Daily Market Commentary: Bulls Hold On

Image
The 20-day MAs have came into play for the semiconductor index and large cap indices. Volume was mixed and some indices performed better than others. One of the better one was the S&P. The index closed near the day's high on higher volume accumulation. The challenge for bulls is getting past the 20-day MA. ($SPX) via StockCharts.com It was the same story for the Dow, except it closed on its 20-day MA. If it was to break through it will run into resistance of the new 'Death Cross' between 50-day and 200-day MAs. ($INDU) via StockCharts.com The semiconductor index was mixed; it held 200-day MA support but couldn't break resistance of its 20-day MA. ($SOX) via StockCharts.com While the Russell 2000 finished just on resistance and remains in the same trouble as before. ($RUT) via StockCharts.com The feel good feeling from yesterday has worn of a little. Now it's important for June/July lows to hold as support when the inevitable period of weakness ar

Stock Breakout: Micrus Corp (MEND)

It has been a tough couple of weeks for stocks but there has been one stock knocking on the door. Micrus Corp ( MEND ) first came to my attention on July 2nd . In my tweet I had initially noted the bearish black candlestick but thought the gap looked like a base breakout. Fast forward to yesterday and the stock again appeared in my July 7th breakout scan and has done very well to negate not just the bearish implications of the black candlestick but hold the breakout gap too. I have made a bullish Trading Idea for a push to $27.75 with a stop at $20.69 (If you register for free with Zignals then click [Follow] on the Trading Ideas tab you will get my latest trading ideas sent direct to your email address). Volume was also impressive. The initial trigger for the breakout was its addition to the S&P 600 . Certainly, with open air above and a fundamental cause to drive it there is a reasonable chance it will make it to its initial target of $27.75 - the measured move from the ba

Daily Market Commentary: Bulls Have A Lash

Image
Day Traders will have enjoyed today and there may be something for those who are looking to hold a little longer. Although it was one-way traffic throughout the day it's only one step of part of larger climb, a climb with many tricky sections to overcome. The semiconductor index and the Russell 2000 were noted as the indices to watch for bulls and bears respectively and it was the bull-watch semiconductor index which came up trumps with a 5% gain (against the 3.7% for the Russell 2000). The gain was also enough to regain the 200-day MA. However, 20-day and 50-day MAs are close enough to add supply and may stall the advance tomorrow. ($SOX) via StockCharts.com The spillover from the semiconductor index was enough to leave a bear trap in the Nasdaq 100 and set up a rally to new channel resistance. Unlike the semiconductor index there is a price void up to the next supply level at converging 20-day, 50-day and 200-day MAs. ($NDX) via StockCharts.com The S&P also produce

Archive

Show more