Posts

Daily Market Commentary: Bears Try Again

Image
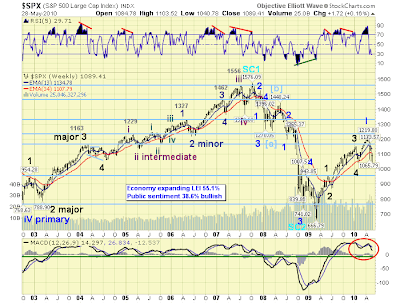
Tuesday's late day selloff was controlled by the tumbling energy sector , although volume was not excessive. The uncertainty undid all of Thursday's gains for the S&P but there is still the spike low at 1,040 to look too for buyers. ($SPX) via StockCharts.com For the Nasdaq, it was back to the 200-day MA and into Thursday's breakout gap. ($COMPQ) via StockCharts.com But the Nasdaq 100 held up well, holding above the breakout gap although it was repelled by the 20-day MA. ($NDX) via StockCharts.com The Russell 2000 fared poorly with relative strength shifting away from speculative issues. This is bad news for bulls looking for a build in momentum; a flight to safety isn't the stuff of bull markets. But the 200-day MA offers a 10-point buffer of support which may be enough room for buyers to mount a challenge. ($RUT) via StockCharts.com Tuesday was the reaction to a long weekend of bad news; bulls will be thankful Wednesday is just a single day! It

Weekly Review of Stockcharts.com Publisher Charts

Image
Another exciting week goes by; but has anyone the edge? Anthony V Caldaro of http://objectiveelliottwave.com / has checked this week; noting the bearish divergence in the MACD, but not changing any of his prior wave counts. Richard Lehman of TrendChannelMagic.com points towards a flat consolidation, but worries if the mild rally doesn't make it up to larger channel resistance c1,120 for the S&P. 5/28 --Even with Thursday's huge advance, the week's action shows flatter short term upchannels than were first indicated. There are still a couple of different angles possible, but they are relatively flat and may alllow more weakness early next week before rising again. If the Dow is going to get to 10,500 and the SPX to 1120, it will now take longer at this angle (i.e. most of next week). If the indexes reverse before even reaching the upper green channel lines, it will be rather negative, as it may suggest that the green channel is accelerating downward. S

Weekly Market Commentary: Trend Down But Breadth Close to 'Buy'

Image
What markets did last week was less the story than what market breadth offered. The S&P finished some 85 points above the first Fibonacci support level with stochastics [39,1] just below bullish support. ($SPX) via StockCharts.com The Nasdaq similarly has a long way to go before it reaches the first of Fibonacci support levels (almost 200 points away). But nothing to suggest a bottom yet. via StockCharts.com The real moves came for breadth indicators. The Nasdaq Bullish Percents finished on rising support connecting 2008/09 reaction lows; the best chance of a bounce before requiring a push to oversold levels. No technical 'buy' yet. ($BPCOMPQ) via StockCharts.com The Percentage of Nasdaq Stocks Above 50-day MA is deep in oversold territory at 24% but no technical 'buy'; it will take a few weeks before the MACD is in a position to do so. ($NAA50R) via StockCharts.com The Nasdaq Summation Index hasn't quite made it to oversold levels either by &#

Daily Market Commentary: Bears Caught Short

Image
The strength of Thursday's buying may in part have to do with what looked to have been a perfect bear set up from Wednesday. Once yesterday's highs were taken out it was going to be hard for sellers to regain control and this was evident with markets closing near the day's highs. The S&P finished at its 200-day MA which may offer bears an opportunity but it is looking like dips will be viewed as buying opportunities ($SPX) via StockCharts.com The Nasdaq made it back above its 200-day MA; declining resistance next to negotiate. ($COMPQ) via StockCharts.com The Russell 2000 offered 200-day MA buyers a hefty return with an over 4% gain. ($RUT) via StockCharts.com With the semiconductor index nestled against declining resistance from April highs. Friday will offer a big test but odds favor an eventual break higher ($SOX) via StockCharts.com So with substantial gains it would be hard to see an immediate follow through with 20-day MA resistance overhead. B

Daily Market Commentary: Bulls Stumble

Image
It was a tough day for bulls where it initially looked like they had the edge. The S&P managed to get back to last Friday's highs but later in the day demand faded and the day finished near the lows. I suspect tomorrow will see a push towards the spike lows with another bear controlled day. ($SPX) via StockCharts.com The Nasdaq came back off its 200-day MA after initially pushing through. Short stop at 2,279 for the nimble. ($COMPQ) via StockCharts.com For the Russell 2000, what looked like a good long at the open is now looking a better short. The gravestone doji suggests Thursday will see a push to Wednesday's 617 low. ($RUT) via StockCharts.com Breadth continued lower and the Percentage of Nasdaq stocks above the 50-day MA is deeply oversold; although Bullish Percents and the Summation Index have room to push lower before they are oversold ($NASI) via StockCharts.com So on Thursday, look for bears to press the early advantage into Tuesday's lows - at

Daily Market Commentary: Buyers Turn Up Late

Image
A day for wild swings with early opening losses giving way to a steady clawback through the day. Oversold technicals suggest days action is some form of confirmation bottom. Even with yesterday's idea to buy Tuesday's open it would have been a brave move in the face of morning heavy selling with pushes beyond what would have been considered safe stop zones. A better opportunity looks to have presented itself here with a loss of today's lows the new stop zone. For the Russell 2000 this offers a second bite of the cherry with a stop at 611. Tellingly, bulls were able to hold the 200-day MA for a third day in a row. Note the bullish divergence in the CCI too. ($RUT) via StockCharts.com While the semiconductor index was able to defend rising support of February-May lows even though it opened the day below the line. ($SOX) via StockCharts.com There was a more traditional spike low for the S&P with an increase in volume ($SPX) via StockCharts.com The Nasdaq 100

Daily Market Commentary: Finding Balance

Image
No surprise to see markets give back some of Friday's late day surge as they work some form of trade worthy bottom. For the S&P, last Friday's low is a good place to define risk with respect to stop placement (perhaps tomorrow's open if it gaps lower might prove a tempting buy???). On the upside it could be a few days before we see the 200-day MA breached but then the rally could push as far as the 20-day MA with declining resistance connecting April-May highs another supply zone. ($SPX) The Nasdaq is a little more difficult to predict given prices remained close to Friday's highs but couldn't push higher, suggesting buyers may be prepared let prices drift back to Friday's low before getting active (prices fall in the absence of buyers even when selling is not particularly intense). If there is a reason to be optimistic it's the holding of the 200-day MA; if prices push above 2,245 then the 200-day MA is the stop-loss zone for long positions. As fo

Archive

Show more