Posts

Weekly Market Commentary: Rally Continues

Image
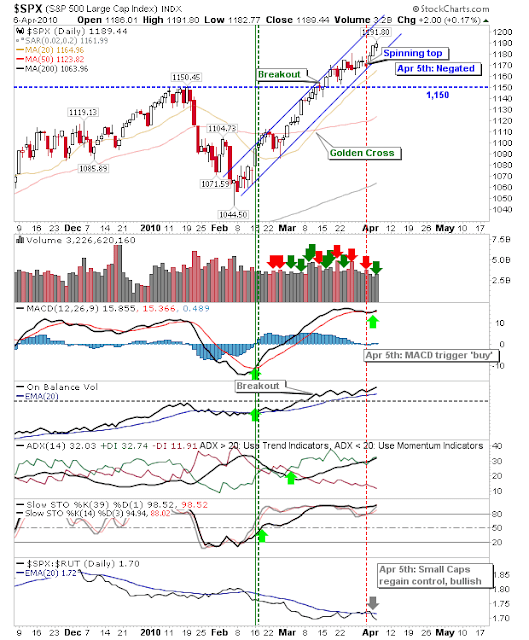
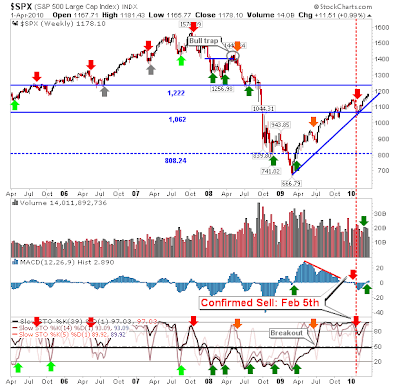
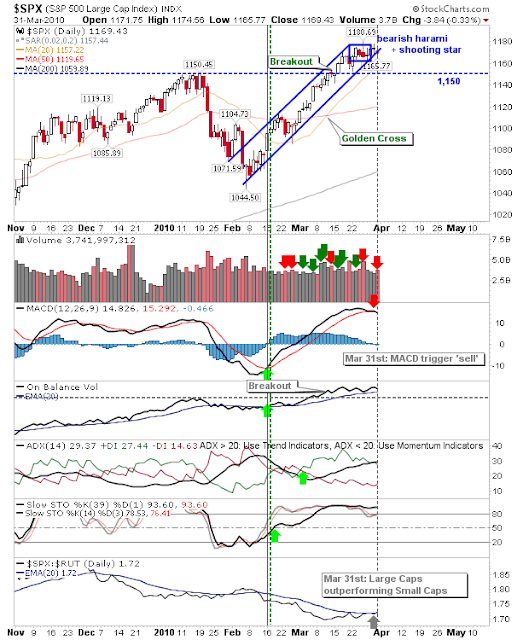
It was another week of gains which kept the 2009/10 rally chugging along. For the S&P there is still 27 points on offer before resistance becomes an issue and even then, comparable resistance as playing for Tech is around 1,400 (or 200 points away). $SPX via StockCharts.com For the Nasdaq it was an opportunity to touch the first of two reaction highs from 2008; it's hard to believe stocks are offering valuations based on pre-bank-fail prices??? The February 5th 'Sell' trigger holds Nasdaq via StockCharts.com The Nasdaq 100 did more by breaking past the lower of the two 2008 reaction highs, bringing the earlier 2008 reaction high around 2,022 into play. Can it reach the latter price? Nasdaq 100 via StockCharts.com Will the Bulltrap 'Buy' come true? Bullish Percents only a few points from prior high of 75% Nasdaq Composite Bullish Percent Index via StockCharts.com Nasdaq Percentage of Stocks Above 50-day MA fast approaching resistance Nasdaq Percent of S

Stock Market Commentary: Bulls Defend Early Losses

Image
The S&P had ducked below channel support in early trading before recovering to close above support but not before a MACD trigger 'sell' was triggered. Small Caps closed with an inside day mixed with a fresh MACD trigger 'buy'; trade break of 2-day range with stop on the flip side. Semiconductors took the brunt of the selling, losing over 1% along with a CCI 'sell' trigger. But the damage wasn't enough to lose rising support. Markets are in mixed form with some giving while others take. With breadth indicators frothy it's better to err on the side of caution but day traders will probably enjoy the volatility these market conditions bring. Follow Me on Twitter Build a Trading Strategy in Zignals; Read how and earn real money (once out of Beta) in this PDF. Dr. Declan Fallon, Senior Market Technician for Zignals.com , offers a range of stock trading strategies for global markets, also available through the latest rich internet applic

Stock Market Commentary: Distribution - But Support Holds For The S&P

Image
In the S&P profit takers emerged but not to the degree sellers were able to break support of the rising channel. Volume registered as a distribution day but not enough to give control to bears. Buyers now have the opportunity to defend support. The Nasdaq churned on huge volume with a doji which was more bearish than the S&P's. Some could argue for a bearish harami cross (the doji sitting inside Tuesday's buying) with technicals growing towards the bear side. Rising support from February critical here. Small Caps are looking similarly vulnerable with combo support of rising support and 691 an important area to defend. The catch comes in the shape of the break and confirmation break in the Dow (based on real candlestick bodies). There has also been three distribution days since the last accumulation day for this index. A worrying precedent has been set if you are of bullish persuasion - even if the index traditionally doesn't lead the market. Note MACD trigg

Stock Market Commentary: Gains Keep On Rolling

Image
The indices posted minor gains, but more importantly retained the gains from Monday. The S&P even managed a minor accumulation day. Channel bands hold. Small Caps delivered the best performance, gaining just over half of percent and is on the verge of a MACD trigger 'buy'. Tech indices were held up by the bearish harami in the semiconductor index. With the recent 'buy' trigger in the MACD on a weak ADX it's not a very potent reversal signal but with a stop over 378 there is a built in protection. The Percentage of Nasdaq Stocks above the 50-day MA cracked over the bearish divergence, climbing to 69%; but this is well off peaks of 86% in 2003 and 83% in 2009. Short covering continues for another day. Follow Me on Twitter Build a Trading Strategy in Zignals; Read how and earn real money (once out of Beta) in this PDF. Dr. Declan Fallon, Senior Market Technician for Zignals.com , offers a range of stock trading strategies for global markets unde

Stock Market Commentary: Positive Jobs Positive Response

Image
The reaction to good news was swift but volume was very disappointing given the significance of the price gains. The action had the characteristics of short covering but while volume was on the downside there were some important technical changes. For the S&P the MACD trigger 'sell' was negated as on-balance-volume nicked a new reaction high. Relative strength swung back towards Small Caps - a bullish development. The support channel line held firm and the bearish implications of the spinning top was negated. The gains in the Nasdaq did not change the bearish technical picture and the shooting star is still in play The best returns came from Small Caps with a fresh breakout (691 new support). The 'sell' trigger in the CCI reversed but not the one for the MACD. Watch for a false breakout. The other strong performer was the semiconductor index. Both MACD and CCI 'sell' triggers were negated. Without buying volume Monday's gains carry a level

Stock Market Commentary: End-of-Week Gains Continue

Image
For the fifth week in a row the S&P closed the week higher but volume was well down on prior weeks. There is still another 50 points or so until resistance is reached and at its current rate it will take another 5 weeks to get there! Stochastics [39,1] are bumping along near max values with an earlier MACD trigger 'buy' still holding. The Nasdaq 100 has already made it to 2008 reaction high resistance with the Nasdaq not far off: The weekly Summation Index may have peaked after posting a loss as the parent Nasdaq gained on the week. And the Percentage of S&P Stocks above the 50-day MA reached 91.4% - although the high of 93% in 2009 didn't do more than a signal a brief paused in the advance. So while the indices keep pumping higher, supporting breadth indicators are very toppish. Will we see another higher close for the week? I suspect this week will see a lower close but will it really kick start a larger decline? Stock Breakout Follow Me on Twitter Build a Trading

Stock Market Commentary: MACD 'Sell' For S&P

Image
Following the weakness which has emerged in Tech and Small Caps, the S&P followed suit with a MACD trigger 'sell'. The index closed with a neutral spinning top which held on to channel support. The Nasdaq is approaching rising support too; Wednesday's mini-Shooting Star played on by confirmed distribution With the Nasdaq 100 joining the 'sell' side Looking for more of the same Thursday. Stock Breakouts Eighteen stocks qualified for my scan but looking through the charts didn't return much: ATSG gained 44% to gap through 20-day, 50-day and 200-day MAs but would need to stabilise above $2.80 to have merit, closed the day at $3.35. IMMR gapped and closed bang-on psychological $5.00 support. The MACD regained the bullish zero line after a 'buy' trigger. The much maligned OSTK surged off 200-day MA support but couldn't maintain all of its gains by the close; $15.00 support is the key area to watch, it closed the day at $16.23.

Archive

Show more