Posts

Blank slate

Image
Whatever vestiges of support which lingered from the early October capitulation were undone by yesterday's selling. The Russell 2000 was the first to crack when it undercut it's first October low in late October, but other indices were well off comparable lows back then. Now only the Dow has early October lows to lean on, but it's unlikely to hold them. It's back to watching the breadth indicators and waiting for a bottom in them before turning eyes back to the indices. The Summation Indices give the best indication of a bottom and these are clearly heading downwards: Lets see what Thursday has in store for us: Futures off so look for a gap down at the open. Get the Fallond Newsletter Dr. Declan Fallon, Senior Market Technician, Zignals.com the free stock alerts, market alerts and stock charts website

Yesterday was a start - but today needs follow through

Image
Only a late day charge rescued what was on course to be a break of support. Volume sided with the bulls in a strong last hour of trading. On a closing basis we have picture perfect support with a solid bullish divergence in money flow. Stochastics are only a hair away from turning oversold (although a bit too close to support to suggest a break of support is needed to make them oversold): The level of angst as measured by the VIX looks to have apexed at the tip of a bearish wedge. However, don't lose site of the mixed breadth indicators; nothing is firmly bullish. All we have is a good case for support to hold, but nothing to suggest a move past neckline resistance. Get the Fallond Newsletter Dr. Declan Fallon, Senior Market Technician, Zignals.com the free stock alerts, market alerts and stock charts website

Your Call: Bank of Ireland

Image
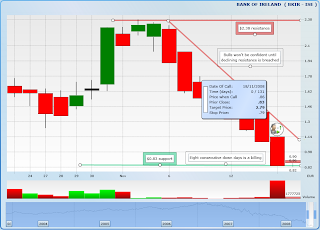
The new YourCall feature on our stock charts allows our chartwatchers to give their projections for their favourite stocks. With its launch less than 24 hours old we have already had some activity in the community. Bank of Ireland's suspension of its dividend and subsequent removal from the Dow Jones STOXX Select Dividend 30 and DJ EURO STOXX Select Dividend 30 Indices contributed to its eight consecutive decline; a decline from 'highs' of €2.38 in early November to Monday's close of €0.83. My own personal call is looking for a retest of November highs near €2.38 with a stop below Tuesday's intraday low (which may yet go lower) at €0.79. JH has gone for a short term target near Monday's highs at €1.10 with a call made from Monday's close at €0.83; JH called a stop at €0.76. TestUser1 (aka Zignals CTO) made a call during Monday's trading at €1.03 but that position was cooked with today's intraday drop to his stop at €0.82. Do you have an opinion

Backtest completed in S&P

Image
Stochastics completed their backtest and switched to a 'buy' based on technical support. With respect to price, the index has returned to support of the mildly declining price channel. There is very little wiggly room for downside, so the index has to rally from the get-go and stay above yesterday's close. Note bear trend strength is weakening and volume patterns have sided with bulls. Transports doing likewise - although stochastics haven't switched to a 'buy'. Get the Fallond Newsletter But breadth indicators remain mixed with a heavy bearish bias (particularly Summation Indices): Dr. Declan Fallon, Senior Market Technician, Zignals.com the free stock alerts, market alerts and stock charts website

Weekly Stock Charts review

Image
Another hectic week in a month full of hectic swings. What did the Stockchart.com ers have to say about it? Yong Pan has the first of two sell signals emerging in the S&P. Is BB width still a little frothy for a bottom (= too much volatilty)? Pan outlines the difficulty markets will have to overcome to classify a follow through day; it looks to be a big ask for Monday ( Futures down in pre-market). Breadth 'sell' signals in Bullish Percents and McClellan Oscillator: Maurice Walker has a long commentary which can be read by following his link . He highlights the Percentage of Stocks Above the 50-day MA as a key indicator for a bottom: Maurice views Friday as a bearish inside day where I would view it as part of a bullish harami. Either way - the two-day highs have to be breached to negate one and confirm the other: His comments on the MACD are important: The MACD should be watched closely. The MACD histogram got a bearish triple M pattern (m-M-m) on the indice daily char

Zignals: Buy-and-Hold Dead? I think not

Get the article here . How-to video to screen and view stocks on Zignals : Dr. Declan Fallon, Senior Market Technician, Zignals.com the free stock alerts, market alerts and stock charts website

Trading Ranges Established

Image
Looks like yesterday's rally threw markets into more prolonged sideways trading ranges, rather than take them another leg down. The boundaries for a breakout remain unchanged from before; just a second band of resistance (a new neckline) was added at November highs to create a double/triple(?) bottom with yesterday's low and the late (and early) October low(s). It's still anyone's game with the Summation Indices favouring bulls and the Bullish Percents aligning with bears. You can see in the Dow chart how neckline resistance is the same whether you looked at this as a head-and-shoulder pattern or a triple bottom. Yesterday's momentum should see it challenge 9,615 For the Nasdaq, angled resistance is key: The S&P is a bit of a hybrid: Get the Fallond Newsletter Dr. Declan Fallon, Senior Market Technician, Zignals.com the free stock alerts, market alerts and stock charts website

Archive

Show more