Posts

Transports Duck is Broke

Image
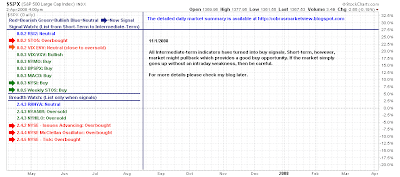
After months of techincal and price weakness we have seen the emergence of a nascent rally in the Transports. Transports will be key in the development of new market leadership given the collapse in oil prices and their role in early economic recovery. Note the break of the 3-month bearish divergence in stochastics; currently overbought in the short term. Plus the weakening of the bear trend. I have marked in Fib retracements as the watch zone on the decline. Nothing in yesterday's action suggested anything more than profit taking in the face of rare gains. But what happens as part of this decline - and where it stops - will be very important for the intermediate/long term picture. TraderMike says it best in his market summary. Thanks to Charles Kirk for the Kirkbert Bump - biggest one day traffic ever! New Visitors - please subscribe either to my feed , or my twitter feed which is routed to cover all my blog posts here, and on Zignals , in addition to links to my PDF newsletter

The Obama Bottom

Image
From the Zignals Blog: In June of this year I introduced the relationship between the S&P and its key moving averages (20-, 50-, and 200-day MAs). At the time the greatest number of matches were made to the pre-crash scenario of 2001 with a similar match to the 2003 meltdown. The conclusion at the time was to wait for a break of the 200-day MA before fully investing long, but to expect declines of between 7% and 30%. On October 6th I talked about the status of the decline and how the then 14% loss might not have been enough. I drew five conclusions from the state of the market at that time: We are likely a couple of weeks from a bottom, but it is not impossible for this to take longer During this period the market will see sharp losses, perhaps trimming 10-20% off where the markets lie now (Monday will be the start) The subsequent rally will be short lived and will morph into a retest of the low The retest will be the time to buy heavy A significant bull market has a good chance

Futures weak - 60-min set for a 'sell'

Image
Futures point to a soft open following a day of gains. The 60-min charts are showing developing weakness with divergences between technicals and price. The Dow has a series of new highs on lower volume The Russell 2000 has already triggered a 'sell' in the MACD. Daily charts all bullish so this should be a retracement, not a return to the withering losses of before. Get the Fallond Newsletter Dr. Declan Fallon, Senior Market Technician, Zignals.com the free stock alerts, market alerts and stock charts website

Summation Indices say Market Bottom in place

Image
Both the Nasdaq and NYSE Summation Indices suggest a market bottom is in place and any weakness from here is a buying opportunity. Expect the first wave of weakness today until the election results are resolved. Get the Fallond Newsletter Dr. Declan Fallon, Senior Market Technician, Zignals.com the free stock alerts, market alerts and stock charts website

Weekly Stock Charts review

Image
Bulls have some room to play with, but how has this changed the larger picture? Yong Pan starts with an interesting set of bullish/bearish views. Half of his breadth indicators are overbought while the S&P trades bullish and bearish signals. Views all of this as a decent 'buying' opportunity. How will the SPY's respond? VIX oversold on overbought breadth: a few days of weakness not to be unexpected. Accumulation/Distribution relationship looking good for a bottom (with some crazy spikes over the last 2 months) Maurice Walker describes a stream of technicals which are favouring bulls However, the DJIA and the S&P 500 rallied 3 out of last 4 days. We got a follow-through on the Dow's bullish belt hold candle pattern, as the bearish descending triangle disintegrate, going up in smoke. For the indices all broke above the 20-day SMAs on Thursday, and what often occurs is prices rise descidvely above that level and then pull back to it as a reliable area of support,

New KIVA loans

Image
Time to recycle repayments back into the system as four new loans come into play. If you would like to contribute please join my newsletter - your first months payment after the free trial period is given to a KIVA project. You can see a complete list of the 83 KIVA loans supported by members here . Get the Fallond Newsletter Dr. Declan Fallon, Senior Market Technician, Zignals.com the free stock alerts, market alerts and stock charts website

Bullish Percents positive once more

Image
Another clean sweep from the Bullish Percents as Nasdaq, S&P and Dow all lie on the bullish side of the fence after the October 22nd bull signals were quickly undone: There was a sharp advance in the Dow bullish percents: With a lesser but still respectable advance for the S&P's: Now it's up to the indices to build on this strength. It will be a long road but seasonally, the worst should be behind. Get the Fallond Newsletter Dr. Declan Fallon, Senior Market Technician, Zignals.com the free stock alerts, market alerts and stock charts website

Archive

Show more