Bulls have some room to play with, but how has this changed the larger picture?
Yong Pan starts with an interesting set of bullish/bearish views. Half of his breadth indicators are overbought while the S&P trades bullish and bearish signals. Views all of this as a decent 'buying' opportunity.
 How will the SPY's respond? VIX oversold on overbought breadth: a few days of weakness not to be unexpected.

Accumulation/Distribution relationship looking good for a bottom (with some crazy spikes over the last 2 months)

Maurice Walker describes a stream of technicals which are favouring bulls
However, the DJIA and the S&P 500 rallied 3 out of last 4 days. We got a follow-through on the Dow's bullish belt hold candle pattern, as the bearish descending triangle disintegrate, going up in smoke.
For the indices all broke above the 20-day SMAs on Thursday, and what often occurs is prices rise descidvely above that level and then pull back to it as a reliable area of support, beginning the early stages of a rising trend.
The daily charts show that the TRIX is giving its blessing to a new rising trend (pg 2), the MACD already did. The Aroon reveals that it is no longer supporting the bears, as the Aroon down is in a freefall. While the ADX line on the ADX has peaked as the DI lines are contracting. The McClellan Oscillator is above zero supporting this rally. The S&P 500 bullish percentage is too.
I am liking his throwback target on the Dow 15-min:

and QQQQs:

So it isn't TRIX or treat, but rather the TRIX will likely now give investors a treat as it signals that prices will move higher from here.
The VIX peaked last week, putting in a hanging man candle pattern. Then on Friday it's intermediate rising trendline was fractured. The bearish triple M (m-M-m) pattern on the histogram continues to play out, which brought about a bearish MACD crossover.
S&P nestled against channel resistance:

Dr. Joe has the summary of the week:

A case is made for a contination of the bull market:

Not mentioned by Joe but this chart looks broken - watch for backtest of 17-month MA:

Keep an eye on the two Ted Burge lines of 898 and 987 in the S&P; this looks to be the actionable zone with a bear trap at the end of October:

Interesting to see the bearish target hit on the ATR Nasdaq chart:

Richard Lehman sees the markets moving in (digesting) sideways patterns. The break in the VIX trend is viewed as the likely catalyst to see this push higher although short term weakness looks favoured:
11/1 -- The seasonal end-of-October upweek is now over and held true to form. It has left us with at least a respite from the steady erosion in major indexes and the nightmarish final hours of trading. Some indexes like the RUT, XLE and FXI are up 20% off their lows already. From a short term chart perspective, the indexes all appear to be in a flat, almost horizontal channel since the Oct 10th low (with the Dow's ST channel actually rising somewhat). That's an encouraging sign, and necessary to digest all the unprecedented things that are happening, but by no means an all-clear signal. We're approaching the upper lines of those horizontal channels and have had a nice mini upleg. There is still upside room in that upleg, but possibly only for a couple of days. Then (if not before), we should be prepared to drop back again. Fortunately, VIX has corrected enough to break its dramatic uptrend and that may signal a further attempt to creep upwards as well as to lessen the violent swings.
Long term charts look more encouraging now also as the steep minis that created the lows this month are being broken to the upside. We are bound to have continuing crosscurrents through year-end as additional tax selling will no doubt occur and further data on the holiday season and rest of the economy comes out.
10/30 -- The picture is getting a bit more clear ( and more bullish) so I'm adjusting the charts accordingly. The short term mini channels upward are intact and as long as they don't break on the open tomorrow, should move even higher still in the next day or two, perhaps decently (another several hundred Dow points or more). But they are definitely mini channels. That means they will break back to a downward mini soon as part of the larger short term picture. The hourlie show this best. The Dow is most bullish, while the olthers are closer to horizontal.
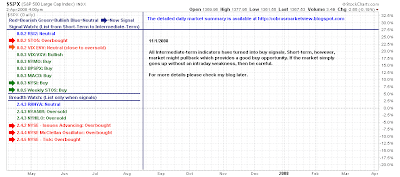
Dr. Declan Fallon, Senior Market Technician, Zignals.com the free stock alerts, market alerts and stock charts website


