Posts

Showing posts matching the search for etoro

eToro Review

Image
440 followers 33 Copiers I'm about 2 months into my eToro experiment. Basically, it's an opportunity to test trading strategies in a live market environment without exposing myself to large capital losses.  What I like is the selection of leverage choices (most of my trades use x5 to x10 leverage, stocks are x1) and the low initial sums which can be risked; for example, you could make a $10 bet on the S&P at x 5 leverage. You can of course risk (much) more and leverage higher, but that is not the purpose of this account for me. Those of you outside of the U.S. can also automatically follow my trades if they wish by copying my account . My performance stats are okay, although I should add, the performance from 2013 to Feb 2015 was down to Apple stock alone! My active trade management covers March and April. As I have intended, my trade risk is low, scoring 4 out of 10 (lower score => lower risk per trade). And since taking over the active management of the

Flat Day

Image
Semiconductors were able to make back some of yesterday's heavy losses, but other indices were little changed. Semiconductors have clawed back nearly 1% and are working off a potential support level of 660. There is a break of rising support in the CCI, which along with continued losses in relative strength, suggests bulls are not out of the woods yet.

S&P Breakout + Tech Support Bounce

Image
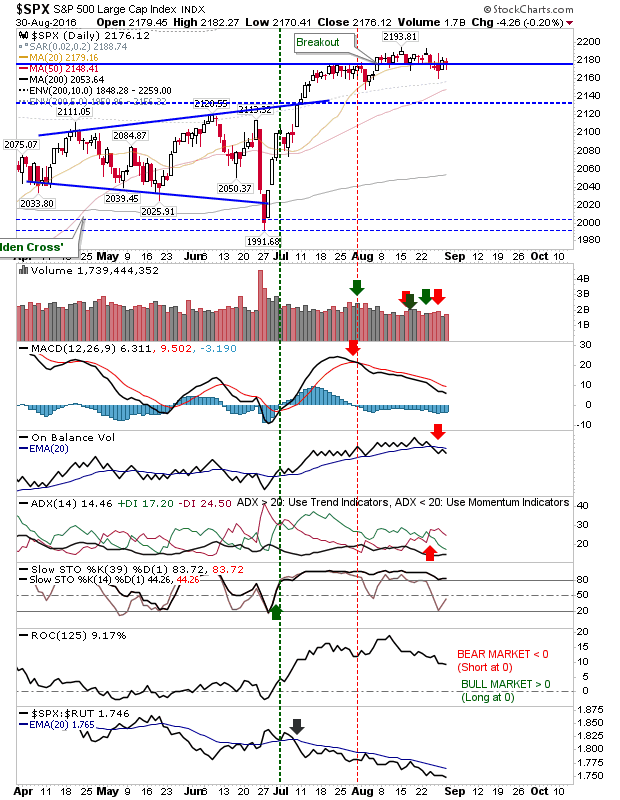
If volume wasn't just a little disappointing this would have been considered a super solid day for bulls. Having said that, shorts will be feeling the squeeze and anyone short the Dow Jones would have been feeling particularly aggrieved. Momentum bull-runner the Dow Jones gapped at the open and finished at the high of the day. Relative performance actually dropped a little but the Dow is clawing back 6-months of under-performance so it can be forgiven for this.

Pause in Advance

Image
With indices knocking on the door of new highs for 2016 it was of new surprise to see some profit taking. The S&P has struggled when it gets to 2,100, but each run at this resistance level weakens its importance as resistance. I have left the marker for the head-and-shoulder reversal, but a close above 2,111 will negate it.

Nasdaq 100 at Support

Image
It was a mixed day for markets. The day started with a gap down but bulls were able to make a respectable recovery to finish well yet still net down on the day. The index best placed for a bounce on Friday is the Nasdaq 100.  In addition to finishing on rising channel support the index has the 50-day MA to lean on too. Today's open started at the 50-day MA.  Technicals do not offer much encouragement with a new 'sell' trigger in On-Balance-Volume to follow the existing 'sell' in the MACD.

Tech Market Technicals Turn Net Positive

Image
Two days of gains have helped re-establish the bullish technical picture for tech indices, Nasdaq and Nasdaq 100. While the improvement was welcomed it didn't come without a price. The Nasdaq broke through declining resistance but also left it itself wedged beneath the former rising channel.  If there is a chance for shorts, then tomorrow could be it.

Bulls Maintain Form

Image
Another day, another day of gains. Nothing significant but enough to keep rallies and recent breakouts intact. There are few trading opportunities - except to hold on to existing positions. The S&P has a potential shorting opportunity at March swing high resistance but given the breakouts in Tech and Small Caps, I'm not entirely convinced by it. Technicals are net bullish except for relative performance which has been in decline since March.

Mini-Bearish Wedges in Lead Markets

Image
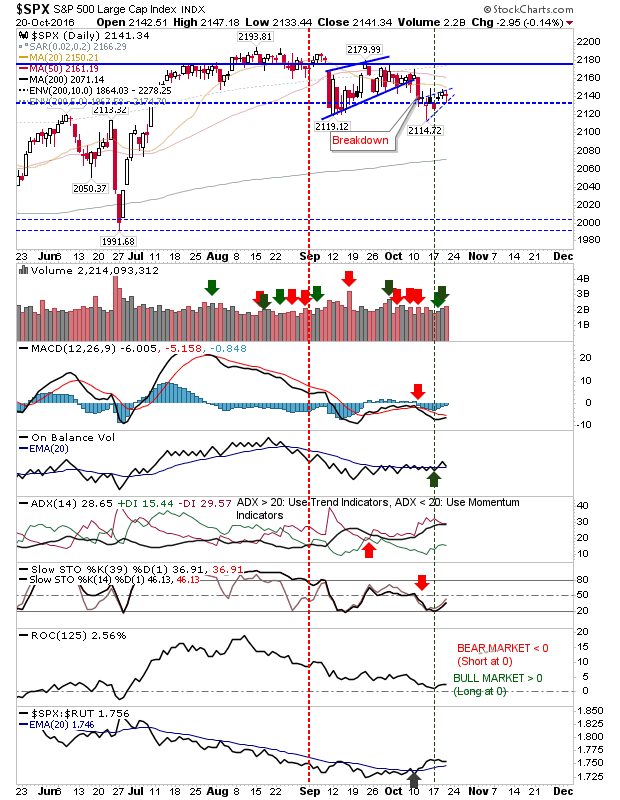
The last few days have seen little movement in key markets. The one potential development to look to resolve tomorrow or Monday are rising wedges in certain markets. The advantage bulls have is that if markets can push above wedge highs (which are close), shorts will be squeezed in a buying scramble. The S&P has a created a small, rising wedge off a larger rising wedge from September. The 20-day and 50-day MAs lend additional overhead resistance as does higher volume distribution for the index today (although the trading range for the day was very narrow).

Blog Traffic Picks Up as Bears Take Control

Image
Blog traffic has doubled over the last three days as 'panic reading' takes hold of the market. Such spikes in readership have in the past acted as good points for a near-term bottom, although today's action does not suggest as such. The S&P and Dow Jones both offered breakdowns from their respective 'bear flags'. The S&P broke from the 'bear flag' and closed just below its 200-day MA. Volume climbed in distribution although there is enough to suggest this could be a support level.

Small Caps Take Another Step Down

Image
Small Caps weren't able to recover the channel and another 1%+ loss was chalked up. It's looking ever more likely a tag of the 200-day MA is on the cards. Relative performance actually ticked up despite the loss but this was an ugly day.

Better from Bulls - Shorts Failing to Apply Pressure

Image
Since the breakdown in wedge support it had looked easier for bears to push indices down to 200-day MAs or lower channel support but action over the last week with two bullish hammers suggests longs may have a launch pad to work with. The S&P is offering a nice setup with the 'bullish hammers' just above the 200-day MAs. The only disappointment was the 'sell' signal in relative performance in the Russell 2000.

Russell 2000 Experiences Profit Taking

Image
Friday's partial trading delivered a final boost before holiday hangover selling kicked in. There is plenty of room for profit taking in the Russell 2000; look to Fib retracements for pullback opportunities. One thing I had missed was the profit take warning in this index; the Russell 2000 has tagged the 14.3% and 12.3% push above its 200-day MA which is in the 10% zone of historic price action dating back to 1987 (see table at the end of this post).

Seniconductor Shorts Gifted Their Positions

Image
For those who took advantage of the resistance test in the Semiconductor Index; there was a picture perfect test of the hashed blue line resistance and secondary break of former rising channel support.  The Semiconductor Index finished bang on the 20-day MA so there may be a little (big?) bounce tomorrow. If buyers can't defend the 20-day MA then the 50-day MA is next.

Small Caps Advance To New 2016 Highs

Image
The Russell 2000 pushed on to clear April's swing high as relative performance swung back in small Caps favor over Tech Indices. The index was the clear winner in what was a quiet day for other indices. There was also a 'Golden Cross'  between 50-day and 200-day MAs.

Russell 2000 Comes Back From The Brink

Image
There was no wiggle room for the index heading into Friday as it managed to claw back the 'breakdown'. It went one step better and posted one of the better performances on Friday.  While the index has come back from support, it hasn't yet challenged the consolidation 'bull trap' - but look for this on Monday.

Tentative Breakouts Fail To Hang On

Image
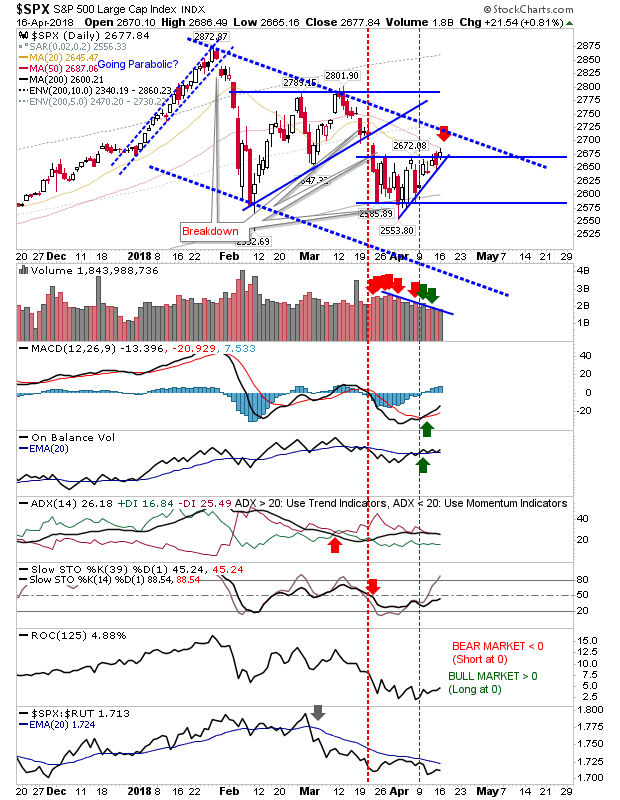
Markets had started Friday above the marked consolidations I had drawn on the charts but subsequently ended the week still inside these trading ranges. As a two-day pattern, Friday's close finished as a bearish engulfing pattern across markets which means I'll be looking for a break of newly drawn ascending support (of the last 8 days) in these indices. The S&P still has a MACD and On-Balance-Volume  trigger 'buy' signals but Friday's high (and the high of the bearish engulfing pattern) was the 50-day MA. Sidelined bulls will want to see a convincing break of the 50-day MA, and probably the downward channel before committing. Bears have the easier play - helped by the strong relative underperformance of the index against its peers. Short the loss of Friday's low with a stop above 2,680.

Small Caps Add To Gains

Image
There wasn't a whole lot of action in markets today. The absence of selling is good news for bulls (more so than the absence of buying is good news for bears). The Russell 2000 was one exception as it gained 0.6%, closing near its highs. Watch for a MACD trigger ' strong buy' in the coming days. The relative performance of the index continues to outperform. The Nasdaq wasn't far behind as it made small gains, but enough to finish near the highs of the day. While the percentage gain was small it did finish with confirmed accumulation. Large Caps had the quietest day of the lead indices, effectively holding station. However, the action does appear to favour bulls (speaking as someone with a non-confident, but minimal risk, short position in play). For tomorrow, it will be a chance for bulls to spread the love from Small Caps and Tech to Large Caps (taking my short position with it). I would like be to wrong, but tight action suggests the next grind will be

Shorting Opportunities?

Image
The indices are edging higher but the presence of 50-day MAs and/or channel resistance overhead does offer an opportunity for shorts to take a position. Market action does appear to be favouring bearish wedges with prices moving towards an apex on declining volume. The current apathy will break and how it does will define the direction of the next market phase. Today's action in the S&P left the index pinned to its 50-day MA. The tight intraday range offers a low-risk short play with a stop above the 50-day MA and an entry on the break of the ascending support line

Small Caps Breakout

Image
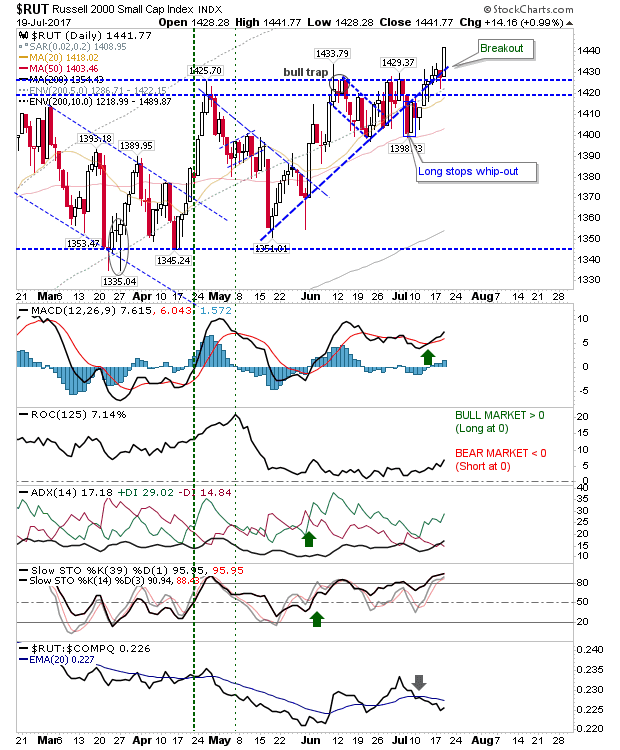
It has taken a few days for Small Caps to make their move but today was the day the Russell 2000 joined other indices in mounting a breakout. It was a clean breakout supported by positive technical strength - putting to bed the June 'bull trap'. Watch for the second round of stop-whips with an intraday move (and recovery) below 1,430.

Little Change

Image
I'm waiting for bears to step in and reverse the nascent breakout but it hasn't happened yet. The intraday range was tight and the change relative to yesterday was small. This left little to add. The S&P still has three 'sell' triggers in MACD, On-Balance-Volume and ADX to work off before the rally resumes.

Archive

Show more