Posts

Showing posts matching the search for etoro

New Year, New Opportunities

Image
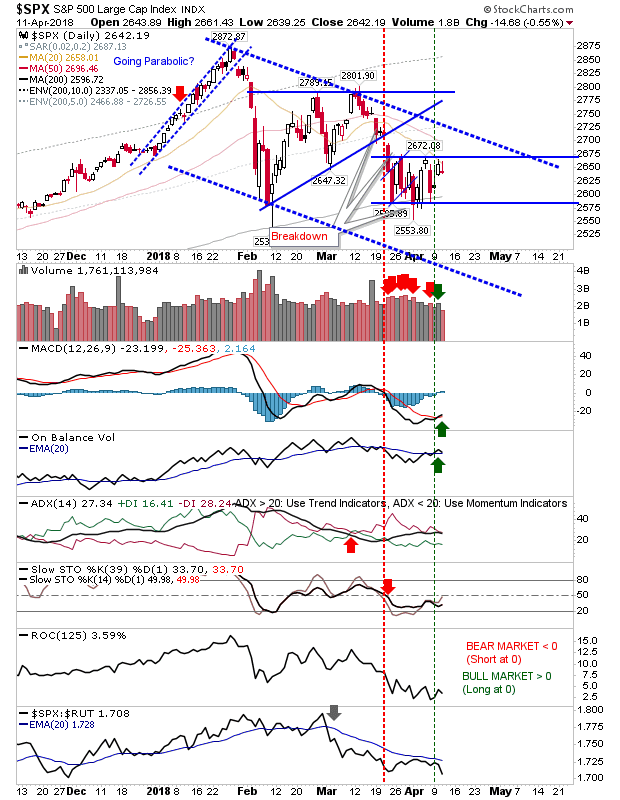
2017 opened with a positive start on higher (albeit low) volume accumulation. The late flourish in the market following the election results helped close 2016 on a positive note. So what will 2017 bring? The S&P wasn't able to hold the bulk of Tuesday's gains, but it did reverse the damage from last Friday.  Not surprisingly, recent volume has been very light so it will be important to see how this changes as traders go back to work. The only technical change over the holiday period was a 'sell' in the MACD.

The Perfect Coil

Image
The indices had another inside day (in a series of inside days) to set up a good swing trade play. With the emergence of spike highs it would suggest a break lower is the favoured move (along with indices performing relatively weak against their peers), but if shorts jump the gun and markers emerge from the coil higher then those shorts will be forced to cover - fueling fresh buying. The S&P is showing this coiling action best:

Range Trading Continues

Image
Tuesday saw some upside from Monday's recovery but the trading ranges I marked on the charts over the weekend remain valid so no change in the status quo. The S&P shows this best with the trading range defined by the former 'bull flag'. Today's close left the index just below resistance. The lower close could suggest another run back to 2,590s.

Another Acceleration in the Rally

Image
Another day of gains pushed Indices to new highs and offered a breakout from the accelerated channel for the Nasdaq but it was the Russell 2000 which took the biscuit. The Russell 2000 added nearly 2% as buyers swooped in to take advantage of recent quiet action.  This follow on to the recent breakout sits the index up nicely for further gains.

Shorts Kick On

Image
There was no Sleeper (long) play for the S&P as sellers took control across all indices. Losses of between 1-2% took effect in Large Cap, Small Cap and Technology indices. The S&P cut clean through horizontal support, 20-day and 50-day MAs, but was never able to challenge channel resistance. Look for a move down to channel support. Technicals are a mix of bullish and bearish signals.

Last Week's Weakness is No More

Image
It was looking to be a struggle after last week's series of 'inverse hammers' had set up what looked like swing highs for indices but these have been cleared by today's gains. In the process of doing so the S&P closed above the 20-day MA with 'buy' signals in the MACD, On-Balance-Volume and Stochastics. Only relative performance is underperforming.

Russell 2000 Passes Last Swing High as Semiconductors Breakout

Image
The Russell 2000 may not be the index pushing all-time highs but the last four days have seen steady gains for the index - enough to generate a new relative performance advantage against strong performing Nasdaq and Nasdaq 100. Leadership from Small Caps is critical for building long-term rallies and this is a good start and an excellent confirmation of the `tweezer`bottom.

Markets Rally But Breadth Remains Weak

Image
Monday enjoyed some follow through upside after Friday's afternoon recovery. However,  gains were on very light volume given the distribution which carried most of last week. Also, market breadth remains in decline from overbought levels. The Nasdaq frames this neatly. The rally has come off a bull defense of the 50-day MA on higher after a series of heavy volume selling days. MACD, On-Balance-Volume and +DI/-DI are in well established 'sell' triggers along with a sharp relative underperformance against the S&P.  Bullish dip buyers will be pleased with today's action, but other factors are running against them.

Dow Follows S&P Breakout

Image
It was a bit of a slow burn day. The S&P held its ground and its breakout without generating significant weakness. However, the Dow managed to post a new closing high although the percentage gain is low and volume was below average.

Market Pause

Image
Nothing really to add to yesterday. Markets took minor hits, but there was little intraday spread. The biggest spread was in the Russell 2000 which was underperforming heading into today's session. It reversed most of yesterday's gains, but it has some way to go before it begins challenging the breakout

I'm on eToro

I'm looking to give eToro a spin for fun. I emphasis the 'fun' because I will only be working with an account of a couple $100 and my positions will be small (about $20 a pop). If you wish to join me, follow this link . Financial sites regulated by small islands are not my idea of financial well being (although we won't mention FXCM), so I will be keeping my account small and I recommend others to do likewise.  The aim is to use eToro as a call tracker with real money, even if the gross amount is tiny. I'll be using it to trade FX, Indices and Commodities, with some stocks (of the limited number they cover). If you already have an eToro account, feel free to follow me .

Semiconductors Hit Hard

Image
Internet troubles have limited me tonight, but the one chart I want to show is the near 5% loss in the Semiconductor Index.  Having escaped relatively unscathed from recent day's selling it was a whirlwind of action for the index today.

Russell 2000 Returns Yesterday Reversal

Image
There wasn't a whole lot of action today but the Russell 2000 did manage to make back yesterday's losses.  The 'bull flag' is still intact and today's buying didn't quite register as a resistance breakout but tomorrow may be the day for follow through.

Russell 2000 at 50-day MA as Indices Mount Morning Recovery

Image
It was a good day for indices as early weakness gave way to sustained buying into the close. There was early morning weakness to set the tone but it didn't last. The one index to rebuff this was the Russell 2000.  After yesterday's respectable finish the index went on to rally back to its 50-day MA. The gains in the Russell 2000 were enough to trigger a 'buy' in the relative performance against the Nasdaq and MACD trigger 'buy'. Momentum buyers won't join the fun until 1,393 is breached, so another 20 points of gains could be on the cards before supply becomes a problem.

Markets Treading Water

Image
Friday was a bit of a non-event for indices as resistance remained a factor. The intraday range was tight as volume rose in suggested churning. The S&P remained at resistance as relative performance again deteriorated from the negative switch earlier in the week. Bears can look to take an aggressive short with a stop above 2,371.

Readying for the Breakout

Image
Today's action was more subtle with indices regaining some of the Monday's lost ground, yet not enough to challenge prior highs. Best of the action was the Nasdaq 100. It's well placed to break above 5,450 and free itself from resistance. The MACD is very close to a trigger 'buy' with good relative performance against improving Russell 2000.

Sellers Challenge Breakouts But Markets Hold On

Image
Trump's tariffs sent markets on a bit of a spin but total selling, while ranked as distribution, didn't go above 1%. More importantly. the bullish setups from yesterday remain valid. Loses in the S&P took the index back to challenging the 'bear trap'. An open around 2,700 could offer a discounted long opportunity.

Small Cap Gains But Tech Distribution

Image
Small Caps were the chief winner on Friday with a near 1% gain. Such action will have pressured Shorts who may have jumped on Thursday's selling from channel resistance. Rate-of-Change is still holding to the bearish side of the market, although other technicals are bullish; relative performance in particular.

Short Covering Driving Gains in Semiconductors and Nasdaq 100

Image
The Nasdaq 100 breakout cleared channel resistance, the fifth significant breakout in four months. All technicals are posting new near-term highs which also meant the short generated on the tag of the rising channel is negated.

Disappointing Earnings Hurt Late

Image
Microsoft and Google are doing their bit to kill the momentum of this respectable rally. While the short term picture gives bears an angle to work with it's going to take more to suggest this rally is done. The S&P had experienced profit taking with higher volume distribution on a bearish evening star. Technicals haven't turned yet, so it's a pure price reversal at the moment, and it's early days.

Archive

Show more