Introduction
It will take a few days for markets to digest recent economic news, but it was clear before any announcements were made this week that the rally from October lows had stalled, and markets have now entered a new phase. The S&P had broken its upward trend on the early week releases of CPI data and FOMC Meeting Notes, but had managed to rally back on positive news from Apple and Amazon. And while the S&P enters a tug-of-war period between bulls and bears, its still 10% above last summer's peak, and 25% above the lows of last October. A breakdown doesn’t necessarily mean a bear market is about to begin, it could simply be the slowing of its prior advance, and more likely, the start of a sideways shift in the market.
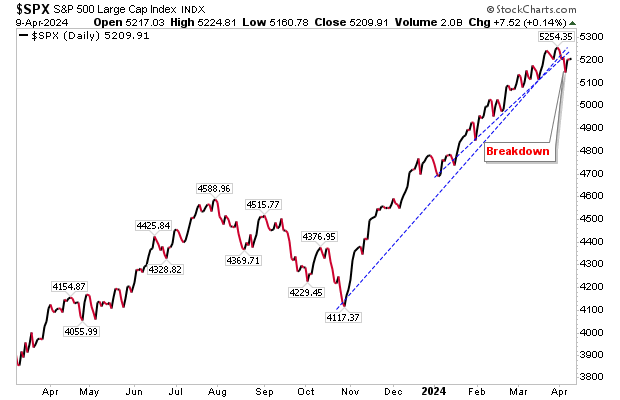
Image: Stockcharts.com S&P long-term chart
Investors will always fear the crash, but one only has to look at a long term chart of an index to see how these declines have ultimately just been pauses as part of a longer advance.
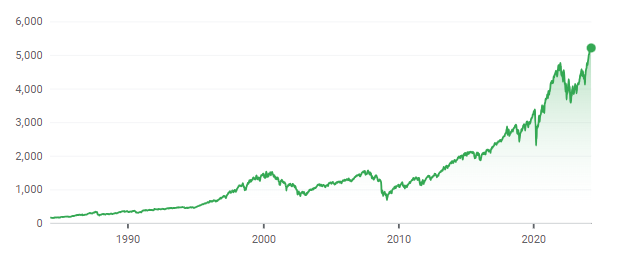
Image: Google Finance. S&P chart
With that in mind, we can look for opportunities from this shift in sentiment. The best way is to look at stocks that have lagged over the course of the recent rally. These “value” propositions offer a good way for new money to cycle into their prior underperformance and one of the quickest ways to find them is to use a performance Market Carpet. A Market Carpet offers a quick snapshot, macro view of the market which can be done quickly, visually.
I’m going to look at the ‘mega’ stocks of the S&P 100. Why these stocks? Their large size offers some protection from an escalation in any further selling, and is a safe haven for investors looking to cycle money from more speculative issues. I’m only going to look at 6-month performance as I want to search for stocks that haven’t participated in the rally from October 2023.
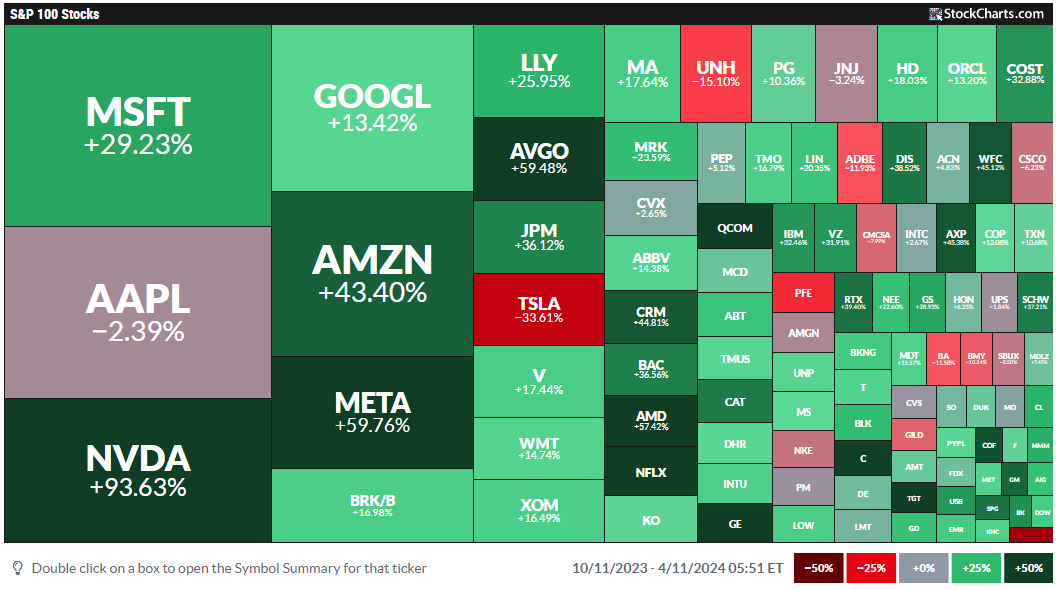
Image: Source StockCharts.com
I want to avoid stocks, like Tesla, that have really struggled during this period, but the glaring candidate from this Market Carpet is Apple (NASDAQ: $AAPL), a stock that I would never have considered to be a candidate under this scan, but surprised with the announcement of a new range of Macs with AI-focused chips.
The Candidate
So why has Apple underperformed while the S&P has soared? Remember, the media will focus on bad news when stocks and markets are down, and good news when markets are up so as they have to fit a story to the action. For example, optimists could argue that with 1 in 7 iPhones now assembled in India, Apple has reduced exposure to its China manufacturing base, given the difficult political relations between the United States and China. On the other hand, pessimists would view 6 out of 7 iPhones manufactured in China (aside from some in Vietnam), as six too many. And if Trump was elected in November, the threat of severe economic sanctions could impact heavily on Apple’s iPhone revenue train.
Chief among the overhangs is the antitrust case with the US Justice Department’s suit over consumer privacy violations. This is layered on top of a €1.8 billion fine from the EU over abusive App store rules for music streaming providers. How the company adapts to such judgements, and changes its business practices so as to not fall foul again, will be critical going forward. But given the stock’s weakness, one would assume investors have already discounted for a negative result from the DOJ suit.
Price Action
The great thing about price is it represents a quantitative measure of all the available news, distilled into a single data point. And how that data point changes over time gives us a story about the stock.
We can see from Apple’s chart it has been range bound for almost a year with a high near a psychological resistance level of $200, and a low near $165, where up until yesterday, it found itself trading near. Not surprisingly, the stocks relative performance against the S&P and the Technology sector SPDR (NYSE: $XLK) over the last six months has fallen off a cliff, but at least there are buyers willing to defend the current price level.
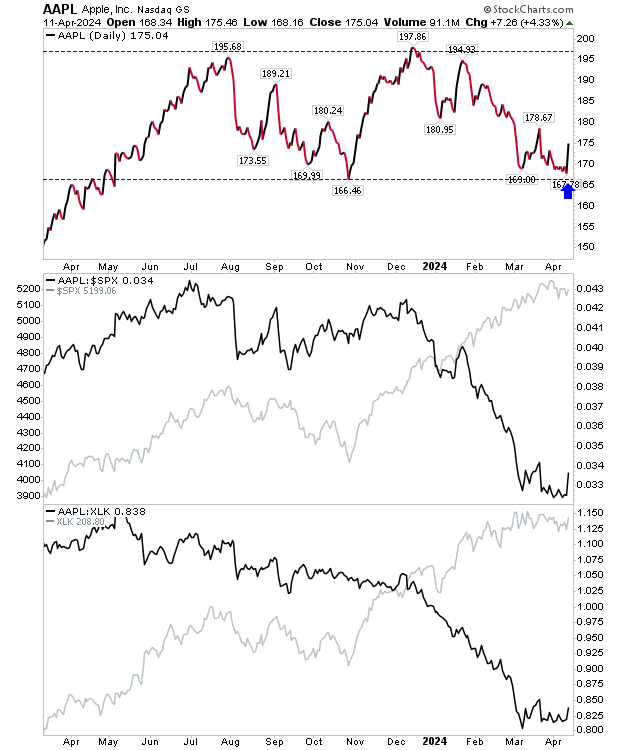
Image: Stockcharts.com
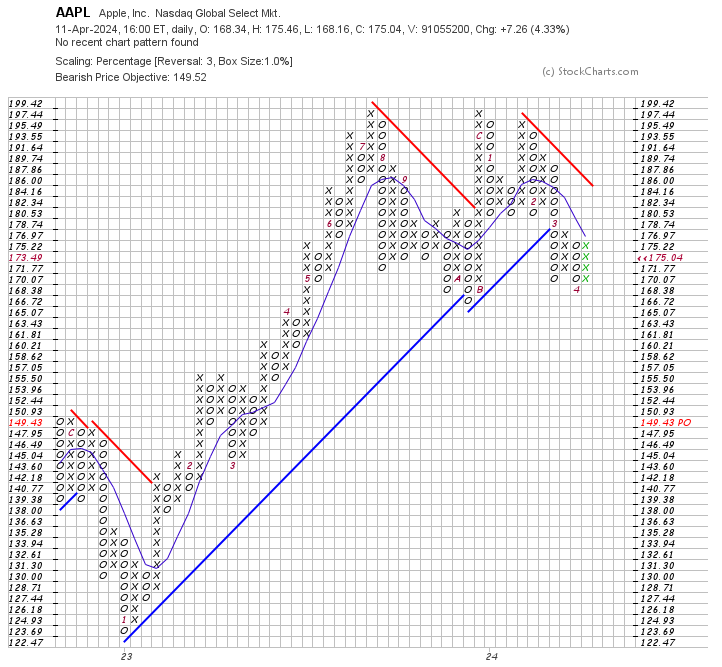
When looking at an asset’s trend, a point-n-figure chart is a great tool; it’s a chart that removes time, focusing only on price and is great for marking trend reversals. The point-n-figure for Apple indicates a new downtrend, but the price objective of $149.43 is near a support zone of $150-155. So even if Apple was swept up by the selling of stocks that had participated in making new market highs, it may attract investment from such sales as investors look for new opportunities to put their money to work.
Business Outlook
Despite the generally negative view on Apple, there was an interesting statistic in the data for Q4 2023 global smartphone shipment market data; it showed Apple gaining market share at the expense of Samsung to return it to top spot at 23%. Unlike Apple, Samsung is coming under increased competition from Chinese companies offering powerful, cheap phones in the Android space. But once an Apple user, nearly always an Apple user, so any risk of users switching to Android is probably minimal. And while market share for Q4 2023 was down a percentage point for the same quarter in 2022, there is a marked stability in is market share; iPhone sales account for 52% of Apple’s $382.2 billion revenue.
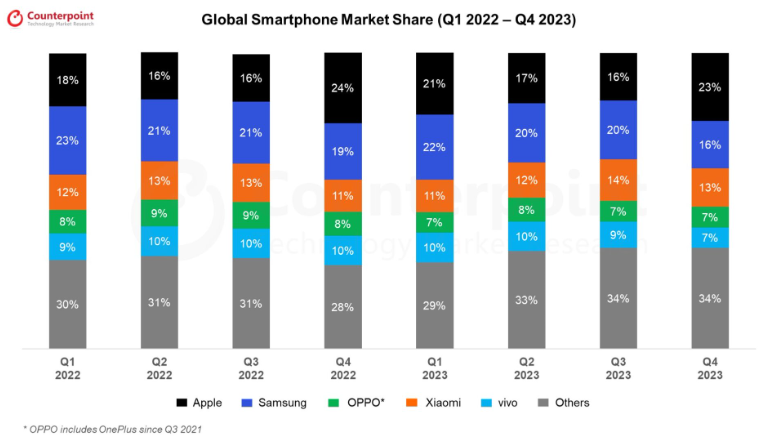
Counterpoint research.
The big revenue mover for Apple is its Services division. Services cover iTunes, App and Book store. In 2023, Apple Services accounted for 22% of its revenue, and is the fastest growing segment for the company (see chart).
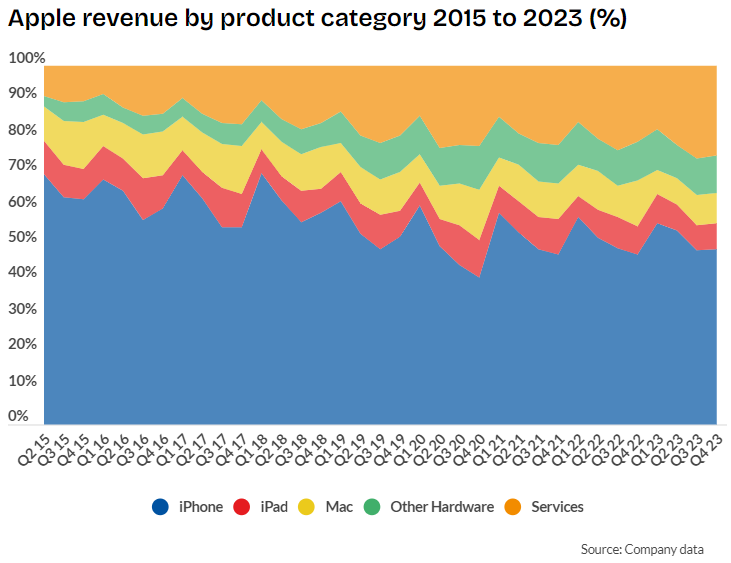
Source: Business of apps website.
For FY2025, Trefis forecasts revenue of $27.9 billion from the AppStore, based on a continued 30% share of gross revenue. iCloud revenues could be a big gainer, expecting to come in at around $10.3 billion, well up on the $4.7 billion reported in FY2020. And AppleCare could also see a doubling from its 2020 revenue to $16 billion.
With any potential outcome of the DOJ suit unknown, any financial penalty will likely be brushed off relatively easily given the cash generating power of the company. The €1.8 billion fine from the EU is just a drop in the ocean for the company and it can now move on. Operationally, if the AppStore has to become more open or flexible to third-parties it may present new opportunities and/or attract existing Android users to switch to Apple.
Peer performance
Given the Market Capitalization of Apple, it’s an Alpha predator and doesn’t really need to concern itself with Android manufacturers. You are either an exclusive iPhone user or a user of one of the many brands of Android. You are either an exclusive Mac user or a user of one of many PC brands running Windows. And in many cases, such as myself, you are a user of both. So comparing to comparable providers in the technology sector is a bit of an apples and oranges scenario.
Independent Analysis
There is no shortage of analysts covering Apple. One point of interest though was a drop in the total number of analysts tracking the stock from 41 to 38. And of Wall Street Analysts still covering the stock, there was an active move in recommendation from “Hold” to “Buy” with a projected price target of $200.13.
Estimize, a crowd-source earnings forecaster, has been more pessimistic on the outlook for Apple than Wall St. analysts, with lower EPS and Revenue forecasts. It should be noted, both Wall Street and Estimize EPS forecasts for the last four reported quarters have been beaten by Apple, suggesting an overly cautious opinion as to the state of Apple’s economic health.
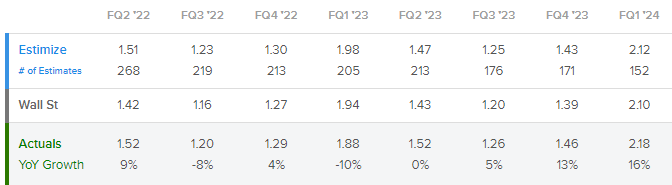
Estimize EPS forecast
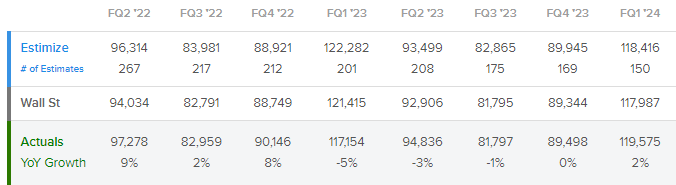
Estimize Revenue Forecast
Furthermore, running headlines used by Seeking Alpha analyst’s articles in a Sentiment Analyzer came back Negative with a 80.6% confidence probability. People don’t want to like Apple no matter what the underlying metrics from the business tell us.
Operational Metrics
Despite the price underperformance, Apple ($AAPL) still holds a $2.6 Trillion Market Cap that is dwarfed only by Microsoft ($MSFT) (in the Technology sector). At current prices, it has one of lowest forward P/E’s (GAAP) amongst Large Cap technology stocks at 26.14; below that of Microsoft, 36.31, but well below Amazon’s 64.12. In addition, because of its low price, it has a competitive Price/Cash Flow (TTM), 22.25 compared to Microsoft’s, 30.64.
Where things slow down is year-on-year Revenue Growth; while the likes of Microsoft, Amazon and Broadcom reported double digit growth, Apple limped in at -0.47%. Forward Revenue Growth is similarly disappointing at 1.46%. Despite the excitement around new ai-chipped Macs, Macs accounted for only 7.7% of Apple’s total revenue in 2023, so there is no magic panacea here.
Where Apples does shine is on its Return on Assets, at 29.5% it’s comfortably above peer Tech giants and it sits on a pile of cash.
As a final point, Apple is never going to win as an income stock with a paltry 0.6% dividend yield, but it has one of the lowest Payout ratios at 14.80%, so there is little risk of a dividend reduction and gives some return for stock holders.
Summary
At least for the coming few days, Apple will enjoy its time in the sun with the magic “AI” banded about in its headlines, but it’s the improvement in iPhone’s marketshare that should help deliver a longer term recovery in price. The secret weapon will be Apple services and the ever increasing contribution to overall revenue. Despite yesterday’s buying, broader market sentiment is negative and it takes a long time to turn an oil tanker.


