The sense of deja vu strikes once more as we consider yet another attempt at a resistance breakout for the Nasdaq, and potentially the S&P too.
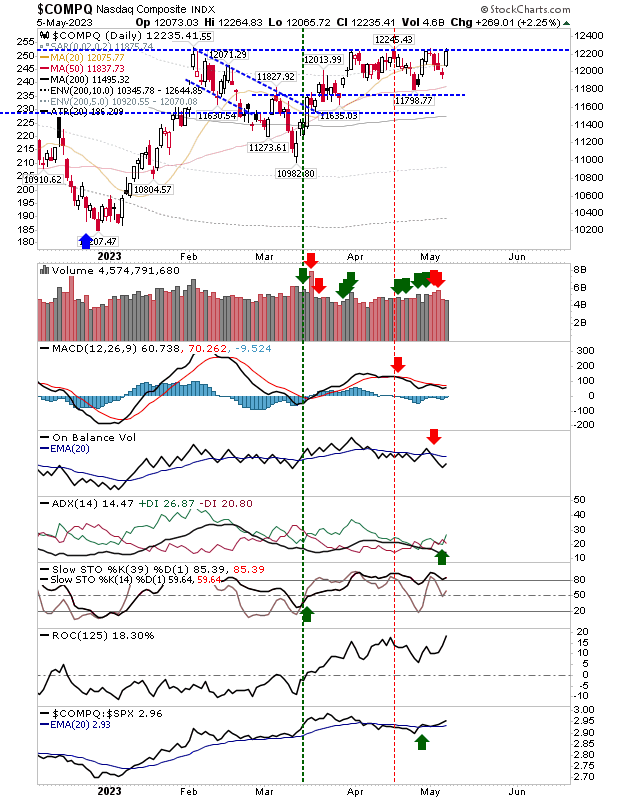
The Nasdaq shows solid price action in preperation for a breakout, but the technical picture is a little more muddled. Momentum (by Stochastics) - the strongest of the indicators here - is firmly bullish. The MACD is flattening a little, but is well above the bullish zero line and on the verge of a new 'buy' trigger. Not surprisingly, the trend metric, ADX, has flatlined. However, On-Balance-Volume is drifting lower after a series of distribution days and this opens the door for a potential 'bull trap' *if* there is a breakout.
The S&P isn't far behind the Nasdaq, but critically, it hasn't managed to pressure resistance to the same degree as the Nasdaq did Friday. Because of this, momentum has dropped out of an overbought state with the same selling pressure in On-Balance-Volume as in the Nasdaq. I would think the Nasdaq would have to breakout first if there was to be any chance for the S&P to follow suit. The bearish take on this would be for a Nasdaq breakout, then a failed attempt from the S&P, before a 'bull trap' in the Nasdaq; but we need to wait and see on this one.
The Russell 2000 remains the bogey index. Maybe there is a double bottom at play here, but to confirm, it will require a close above $180 ($IWM), and ideally, the 200-day MA too. Unlike the Nasdaq and S&P it remains a long way from driving a move to new highs. Ironically, On-Balance-Volume points towards slight accumulation, which may make this the sleeper hit of the indices.
I haven't mentioned the Dow Industrials Average in a while, but it has been caught in a trading range for most of 2023, and the latter part of 2022. The index has been underpeforming the Nasdaq 100 for most of the early part of this year, but there have been signs this is changing. It's unlikely to be the focus of attention in the coming weeks, but one to track.
The other watch is the Semiconductor Index. It's looking a little more shaky. We have a trendline break (and confirmation of the break), but we have a horizontal support to work with too. Semiconductors have been falling off the relative performance cliff against the Nasdaq 100, which is problematic, but if the Nasdaq can breakout this might improve things.
Again, keep an eye on the Nasdaq (once more) and look to supporting moves in the S&P and recovery in the Semiconductor Index. Over the coming weeks, we will want to see a break above $180 in the Russell 2000 ETF ($IWM).
Get a 50% discount on my Roth IRA with a 14-day free trial. Use coupon code fallondpicks at Get My Trades to get the discount.
---
Follow Me on Twitter
Investments are held in a pension fund on a buy-and-hold strategy.


