Inside day losses
The December rally, which was looking vulnerable as of Monday, managed to resume its trend before giving back some of those gains today. I'm still looking for a larger move back to retest breakout support, which may start as of today, but today's selling volume was well below recent buying - so the percentage loss looked worse than it actually was.
The Nasdaq loss did little damage to the technicals and relative performance continues to surge. The 20-day MA is crossing above the 200-day MA, so the 20-day MA is likely to be the first area of potential support to be tested should the current selling continues.
The S&P also enjoys a net bullish technical picture, although strength is not as robust as for the Nasdaq. More importantly, relative performance (vs the Russell 2000) has been particularly weak - although it has improved over February.
The Russell 2000 is underperforming against the Nasdaq, but is still edging it over the S&P. Other technicals are net bullish and the current pullback has the look of a 'bull flag'.
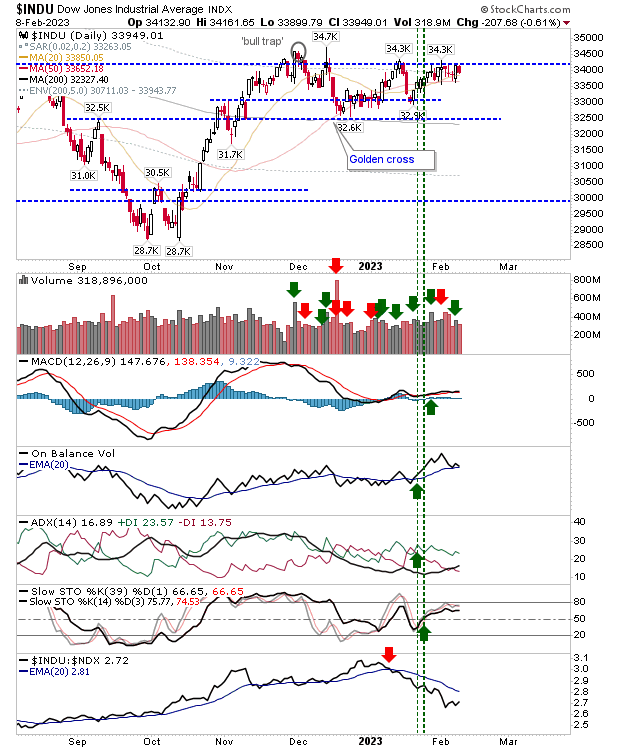
The Dow Jones Industrial Average had been the high flyer, but the breakout as happened in other indices has yet to occur. If you were a trader looking for a breakout opportunity, this is the index to buy. I would be looking for a breakout here soon.
For the remainder of the week I would be okay with further (low volume) losses, but I don't want to see a significant undercut of breakout support for any of the aforementioned indices. It may prove to be 20-day MAs that play a key role in marking an end to any extended decline that emerges from here.
Get a 50% discount on my Roth IRA with a 14-day free trial. Use coupon code fallondpicks at Get My Trades to get the discount.
---
Investments are held in a pension fund on a buy-and-hold strategy.


