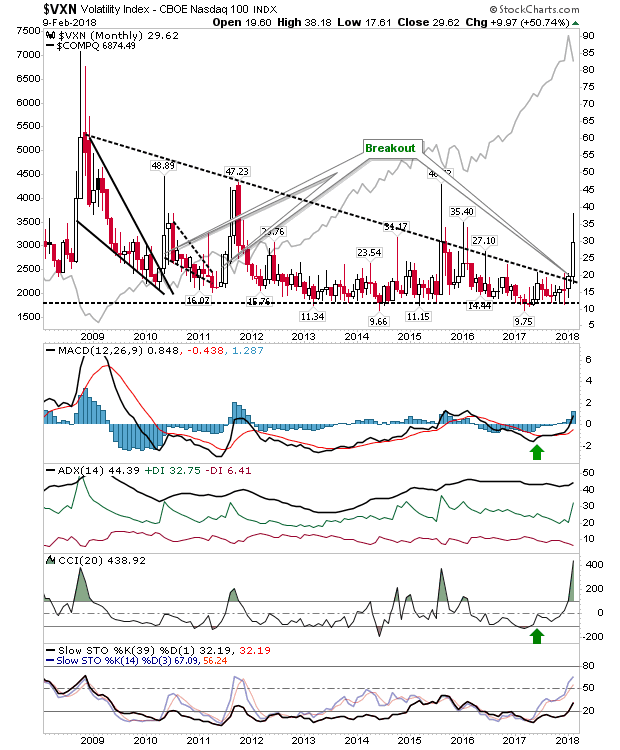
The story of volatility has been overplayed the past week but this has as much to do about the general lack of volatility since the market lows of 2009. February has the potential - although there is plenty of time left to change this - of marking a shift towards a period of high volatility comparable to that of 2008. It doesn't necessarily mean markets will crash as they did in 2009 but it could be a rocky ride for those over trading their accounts.

What this meant for markets were positive tests of 200-day MAs and slower support trendlines. The Russell 2000 made a couple of successful spike low tests of the 200-day MA. If you are prepared to use a wide protective stop (which means a small position) then buyers could start building into a position on the assumption this is just a larger than an expected pullback, made to look worse given the nature of perpetual small gains during 2017. If you are following my buyers guide based on the relationship of the index to its 200-day MA, then there is still some way to go.
The Dow was an index which finished Friday resting neatly on a rising support line. Friday was so volatile it transversed the entire range and then some of one of the rising channels from 2017. Volume climbed to register as accumulation - a reasonable sign of a possible capitulation by 'weak hands'. I would like to see relative market performance (vs Tech and Small Caps) pick up but it's not a bad start.
The S&P made a solid spike low at its 200-day MA. As with the Dow Jones Industrial Average there was a spike in accumulation. While wannabe buyers may feel they have missed the chance at the 200-day MA there will probably be another opportunity when markets look to retest Friday's lows. Bulls will want traders to fight back on any push into Friday's lows.
The Nasdaq also spiked nicely on Friday but didn't make it down to its 200-day MA. The positive is the relative leadership from Tech stocks for 2018. Also, while the index didn't make it to the 200-day MA it did find itself successfully defending a channel support line from 2017. Given its leadership role, there is a good chance bulls will want to come back and take this one higher.
The Semiconductor Index is another which could help Tech averages. It too finished nicely on a former channel support level (lots of successful end of week support tests). The spike low also isn't as far away from Thursday's low as other indices put themselves.
Of longer term charts, the relationship between Dow Jones Industrials and Transports (the Dow Theory relationship) finds itself back at support. Will the 'bear trap' hold and bounce Monday or will it collapse in a rout towards 0.20s as it traded around 2003.
Important note here, markets are still posting significantly more 52-week highs than 52-week lows. A major market low won't come into effect into new 52-week lows outgun new 52-week highs (see 2009, 2011 and even 2016) and this is some way off. This actually plays more into the hands of those who consider current action a pullback - or at least a buying opportunity. If on the subsequent bounce the number of new 52-week lows starts to creep higher then I would have doubts about the bounce, but we need to see a bounce first before we can even consider this.
I'm also watching a chart from Andrew Thrasher - a monthly Nasdaq chart with 9-month MA. This has offered itself as a good long term trend guide. There was a false top in 2016 which had looked to be a reversal off the Y2K peak before Trump ruined that. Will we be looking at a Trump top heading into Congressional elections in 2018; perhaps sell the election result???
The final chart from J.C. Parets is the relationship between Consumer Staples and Discretionary. Aside from the push to the new all-time high I'm not seeing too much of interest here.
So, markets likely are at a pullback buying opportunity but how the bounce evolves will be of interest. I would like to see a harder sell-off - one that I wanted 2016 to deliver but didn't. However, what I want and what the market will offer are not the same. I wouldn't be buying long term investments here - wait until markets come into my box range set in the table below; that last buy signal was February 2016 and it may be later this year when the next long-term buying opportunity comes into effect.
You've now read my opinion, next read
Douglas' blog.
I trade a small account on eToro, and invest using Ameritrade. If you would like to
join me on eToro, register through the banner link and search for "fallond".
If you are
new to spread betting, here is a guide on position size based on eToro's system.

---
Accepting KIVA gift certificates to help support the work on this blog. All certificates gifted are
converted into loans for those who need the help more.
Follow Me on Twitter
Dr. Declan Fallon is a blogger who trades for fun on
eToro and can be copied for free.
. I invest in my pension fund as a buy-and-hold.


