Wednesday's gap created a significant reversal, stalling the mini-rallies kicked off in April. Thursday and Friday generated some come back against last week's loss, bringing many of the markets back to the highs of the gap down.
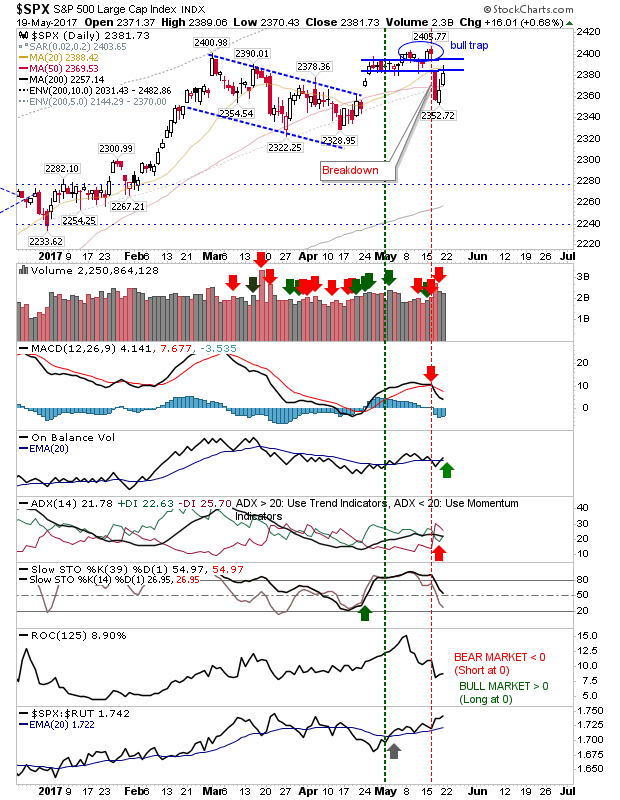
The S&P is in a position where shorts may look to attack the gap. Friday's spike high put itself inside the gap, recovering the 50-day MA in the process. This gain was supported by a 'buy' trigger in On-Balance-Volume. While shorts might have the better risk:reward option, a move above 2,389 opens up for a retest of 2,405.
The one index which struggled with the recovery rally was the Russell 2000. The break from the 'bear flag' has struggled to make it back to the top of Wednesday's high, or even the 50-day MA. Technicals are weak and the relative performance of Small Caps against Tech indices has accelerated lower. The 6-month picture is range bound which keeps the broader outlook as neutral, but this will change if 1,345 is breached to the downside.
The Nasdaq was able to make back more of Wednesday's lost ground, but left itself stalled at its 50-day MA. Volume was lighter than the S&P which suggests buying strength is weakening. The index is offering itself as another aggressive shorting opportunity with a stop above 6,107. Technicals haven't changed with the MACD trigger 'sell' still in play.
The Semiconductor Index was another recovery which looks to have run its course by Friday's close. However, it doesn't have a weak technical picture and a breakout in relative performance against the Nasdaq 100 is only a short hop away.
As for longer time intervals. The relationship between Consumer Staples and Discretionaries still has room for upside before the ratio reaches resistance and/or technicals become overbought. Those on a buy-and-hold strategy have not got a clear 'sell' signal yet.
The relationship between the Dow Index and Dow Transports has also been very rocky throughout 2017. Transports have struggled to match the pace of the Dow Index, suggesting a weak economy which will undermine support for gains in the Dow Jones/S&P. All is not lost and a positive test of this ratio associated with 2016 lows could see a second (third?) wind for Transports and a fresh boost for the economy.
Finally, Nasdaq breadth metrics are all on 'sell' triggers, with the Summation Index and Percentage of Nasdaq Stocks above the 50-day MA drifting in bearish divergences. While such scenarios can last months to years before marking a top it does offer a potential warning sign - although these metrics tend to be more reliable in marking a bottom than a top; see 2013.
For tomorrow, shorts can look for quick nip-and-tuck plays for the Russell 2000, Semiconductor and Nasdaq Indices. Those with a long bias can perhaps look to the S&P and a chance to push inside the gap down - opening up for a challenge of the 'bull trap' and multi-year highs. The S&P looks to be the 'safest' of the lead indices.
You've now read my opinion, next read
Douglas' blog.
I trade a small account on eToro, and invest using Ameritrade. If you would like to
join me on eToro, register through the banner link and search for "fallond".
If you are
new to spread betting, here is a guide on position size based on eToro's system.

---
Accepting KIVA gift certificates to help support the work on this blog. All certificates gifted are
converted into loans for those who need the help more.
Follow Me on Twitter
Dr. Declan Fallon is a blogger who trades for fun on
eToro and can be copied for free.
. I invest in my pension fund as a buy-and-hold.