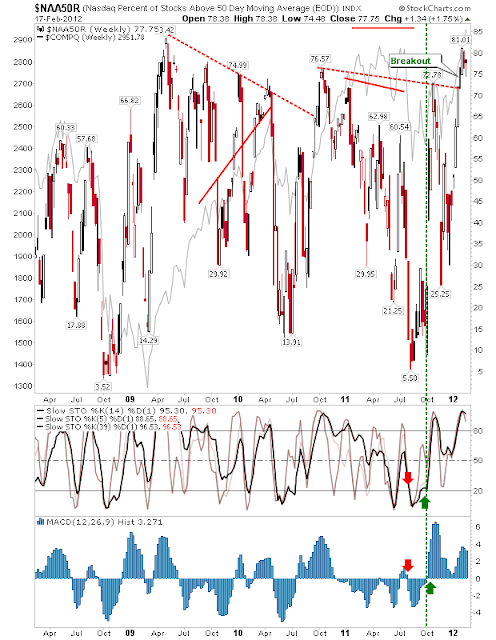
After weeks of steady gains, advances in market breadth slowed or reversed. The majority of market breadth indicators are overbought, although some - like the Bullish Percents - still offer room for upside. Meanwhile parent indices managed to close last week with gains. Swing highs in market breadth often lead swing highs in parent indices, although sharp declines in indices usually occur after a successive series of lower highs and lower lows in market breadth. In the current situation we are probably looking at just the start of such event.
A case in point is the Nasdaq Bullish Percents. The Percentage of Nasdaq Stocks above the 50-day MA has topped out at around 80%. The last time this breadth indicator topped above 80% was in early 2009. Back then, the resulting reversal in the parent Nasdaq was barely a blip in its broader advance - it wasn't until 2010 that the Nasdaq rolled over in force.
The Nasdaq Bullish Percents haven't reached the rarefied heights of 2009 or even 2010. Because of this, this market breadth indicator was able to close the week with yet another higher. This could mean more short term upside for the Nasdaq.
The Nasdaq Summation Index reversed just shy of an all-time high, but like the Percentage of Nasdaq Stocks above the 50-day MA suggests this is only the start of a topping process and not the actual top for the Nasdaq.
Indeed, the Nasdaq closed the week with a new all-time high. It has the benefit of two key support levels to lean on; 2,880 from the breakout and 2,700 from the most recent 'congestion' level. So while the peak in breadth may mean a reversal is about to begin, there is a good chance buyers will step in at one of the aforementioned support levels.
It was also a good week for Small Caps. Friday's finish saw the index reverse the prior week's small losses, although it still has a way to go before it can challenge highs of 868.
Likewise, Large Caps are keeping pace with the gains in Small Caps and Tech. The S&P is just 10 points shy of taking out its 2011 high, with the 2008 high not far away.
Going forward the rallies should be able to maintain their momentum, driven by demand for more speculative Tech and Small Caps issues. The next decline for the indices is likely to be mild, likely finding support at swing highs from October 2011 as a worst case. The bullish outlook remains favored until proven otherwise.
------
Follow Me on Twitter
Dr. Declan Fallon is the Senior Market Technician and Community Director for
Zignals.com. I offer a range of stock
trading strategies for global markets which can be Previewed for Free with delayed trade signals. You can also view the top-10 best trading strategies for the US, UK, Europe and Rest-of-the-World in the
Trading Strategy Marketplace Leaderboard. The Leaderboard also supports advanced search capability so you can tailor your strategies to suit your individual requirements.
Zignals offers a full suite of FREE financial services including price and fundamental
stock alerts,
stock charts for Indian, Australian, Frankfurt, Euronext, UK, Ireland and Canadian stocks, tabbed
stock quote watchlists, multi-currency
portfolio manager, active
stock screener with fundamental trading strategy support and
trading system builder. Forex, precious metal and energy commodities too. Build your own strategy and sell it in the MarketPlace to earn real cash.
You can read what others are saying about Zignals on
Investimonials.com.
JOIN ZIGNALS TODAY - IT'S FREE!


