Weekly Review of Stockcharts.com Publisher Charts
While the week is already underway (and resistance breakout) what had the stockcharters to say about last week.
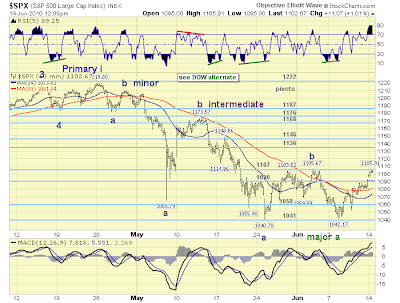
Anthony Caldaro of Objectiveelliotwave has a 60 minute chart which shows a key resistance test underway (now!) at 1,105.
There is a weekly support line in the MACD which is worth watching
Richard Lehman of Trendchannelmagic.com refers to resistance channels which have breached on Monday's open.
Although I see gold heading in the other direction:
Yong Pan of Cobrasmarketview has a broad set of neutral market signals.
His automated system is still short with a loose stop.
Treasury yields continue to trend down:
Michael G Eckert of EWTrendsandcharts.blogspot.com is looking at a five wave push down on the S&P daily; the second wave has room to run to the upside (1,150?) before the killer third wave begins. Watch closely.
His S&P 60-minute chart drills this second wave down more; watch Fib levels between 1,110 and 1,151
Dr. Joe gives his weekly summary
Bottom in the banking index?
Watch broadening wedge support for the Summation Index
Finally, Robert New has listed support for the S&P at 50-day and 70-day EMAs.
Big week ahead...
Follow Me on Twitter
Build a Trading Strategy in Zignals; Read how and earn real money (once out of Beta) in this PDF.
Dr. Declan Fallon, Senior Market Technician for Zignals.com, offers a range of stock trading strategies for global markets, also available through the latest rich internet application for finance, the Zignals MarketPortal or the Zignals Trading Strategy MarketPlace.
Zignals offers a full suite of financial services including price and fundamental stock alerts, stock charts for Indian, Australian, Frankfurt, Euronext, UK, Ireland and Canadian stocks, tabbed stock list watchlists, multi-currency portfolio manager, active stock screener with fundamental trading strategy support and trading system builder. Forex, precious metal and energy commodities too.
Build your own trading system and sell your trading strategy in our MarketPlace to earn real cash. Read what others are saying about Zignals on Investimonials.com.
JOIN US TODAY - IT'S FREE!
Anthony Caldaro of Objectiveelliotwave has a 60 minute chart which shows a key resistance test underway (now!) at 1,105.
There is a weekly support line in the MACD which is worth watching
Richard Lehman of Trendchannelmagic.com refers to resistance channels which have breached on Monday's open.
6/10 -- Today's relief rally combined with the downward slope of the short term purple channels brings the Dow, S&P and a number of other indexes very close to the upper purple channel lines. That will be a critical meeting as a failure would signal another downleg, while a break upward would take us out of the ugly purple channel that has anchored us down since April 26th.
6/9 -- The steep narrow red minichannels were indeed just part of something larger, and we now see the larger mini thanks to today's reversal. So we are now heading lower in these wider red minichannels inside larger short term downchannels (purple) inside still larger long-term downchannels (red on the one-year charts). Need I say more?
Oil, gold and China are still reasonably brighter spots and Toronto and Bombay aren't suffering either.
6/8 -- The bounce I said to expect early this week has now arrived. Looks like a few red minichannels are breaking and that this bounce can carry a bit further. BUT, those red minis are very narrow and may very well only be the first leg of larger minis. That means a break may not carry very far. At most, it will hit the purples again for significant resistance.
The longer term charts say we may not hit a bottom for weeks and that it could be another 5-8% lower.
6/7 -- The bounce lasted about 30 minutes and 50 Dow points today before collapsing. The drop subsequently took out numerous lower blue mini lines, sending price action into red minichannels heading downward. (SPX and a couple others were exceptions.) That will keep things firmly entrenched in their downtrends for the time being.
Although I see gold heading in the other direction:
Yong Pan of Cobrasmarketview has a broad set of neutral market signals.
His automated system is still short with a loose stop.
Treasury yields continue to trend down:
Michael G Eckert of EWTrendsandcharts.blogspot.com is looking at a five wave push down on the S&P daily; the second wave has room to run to the upside (1,150?) before the killer third wave begins. Watch closely.
His S&P 60-minute chart drills this second wave down more; watch Fib levels between 1,110 and 1,151
Dr. Joe gives his weekly summary
Bottom in the banking index?
Watch broadening wedge support for the Summation Index
Finally, Robert New has listed support for the S&P at 50-day and 70-day EMAs.
Big week ahead...
Follow Me on Twitter
Build a Trading Strategy in Zignals; Read how and earn real money (once out of Beta) in this PDF.
Dr. Declan Fallon, Senior Market Technician for Zignals.com, offers a range of stock trading strategies for global markets, also available through the latest rich internet application for finance, the Zignals MarketPortal or the Zignals Trading Strategy MarketPlace.
Zignals offers a full suite of financial services including price and fundamental stock alerts, stock charts for Indian, Australian, Frankfurt, Euronext, UK, Ireland and Canadian stocks, tabbed stock list watchlists, multi-currency portfolio manager, active stock screener with fundamental trading strategy support and trading system builder. Forex, precious metal and energy commodities too.
Build your own trading system and sell your trading strategy in our MarketPlace to earn real cash. Read what others are saying about Zignals on Investimonials.com.
JOIN US TODAY - IT'S FREE!


