
(Mid-) Weekly Review of Stockcharts.com Publisher's charts
With the Bank holiday in Ireland this is a day late, but the tone is unlikely to be anything different!
Anthony Caldaro of Objectiveelliotwave views the current undercertainty of the past week-and-a-bit as the first wave of a larger third wave higher; that is, there is more juice in the tank for bulls and current weakness is a buying opportunity. Listed targets of 1,219 (hit) and 1,326 remain.

Yong Pan of Cobrasmarketview has kept with neutral signals on the short term and a bearish slant on the intermediate time frame.

Yong Pan's automated strategy has already taken profits for the March run but has a new long signal in play.

Although other 'sell' triggers remain

Going back to earlier short term signals, Peter has a suggested target of $125 as part of the triangle (another reason to be a buyer?)

First suggestion of a broadening wedge in the Nasdaq 100

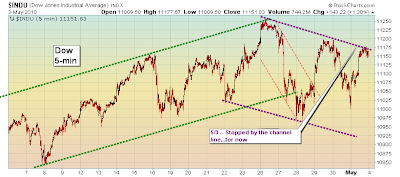
Richard Lehman of Trendchannelmagic.com has marked in new downchannels on 5-minute charts with resistance hit on Monday's close.

Thomas Shadburn Shanky's Charts and his Shankystechblog shows support levels crossed with Fib retracements although technicals are oversold and suggest some bounce soon.

Finally, Joe takes us through the week:

Weekly Dow shown pinned to 61.8% retracement

While weekly Summation Index gently rollsover = bearish for Nasdaq over the next 3 weeks to 3 months.

So while futures indicate a weak start for Tuesday there are conditions for the rally to continue for a little while longer. Can Tuesday close with a flourish?
Follow Me on Twitter
Build a Trading Strategy in Zignals; Read how and earn real money (once out of Beta) in this PDF.
Dr. Declan Fallon, Senior Market Technician for Zignals.com, offers a range of stock trading strategies for global markets, also available through the latest rich internet application for finance, the Zignals MarketPortal or the Zignals Trading Strategy MarketPlace.
Zignals offers a full suite of financial services including price and fundamental stock alerts, stock charts for Indian, Australian, Frankfurt, Euronext, UK, Ireland and Canadian stocks, tabbed stock list watchlists, multi-currency portfolio manager, active stock screener with fundamental trading strategy support and trading system builder. Forex, precious metal and energy commodities too. Build your own trading system and sell your trading strategy in our MarketPlace to earn real cash.
Read what others are saying about Zignals on Investimonials.com.
JOIN US TODAY - IT'S FREE!
Anthony Caldaro of Objectiveelliotwave views the current undercertainty of the past week-and-a-bit as the first wave of a larger third wave higher; that is, there is more juice in the tank for bulls and current weakness is a buying opportunity. Listed targets of 1,219 (hit) and 1,326 remain.

Yong Pan of Cobrasmarketview has kept with neutral signals on the short term and a bearish slant on the intermediate time frame.

Yong Pan's automated strategy has already taken profits for the March run but has a new long signal in play.

Although other 'sell' triggers remain

Going back to earlier short term signals, Peter has a suggested target of $125 as part of the triangle (another reason to be a buyer?)

First suggestion of a broadening wedge in the Nasdaq 100

Richard Lehman of Trendchannelmagic.com has marked in new downchannels on 5-minute charts with resistance hit on Monday's close.

5/3 -- Another strong bounce brought the Dow, Naz, QQQQ, and others right to their upper short term channel lines. Only the SPX went slightly above. Tomorrow will thus tell us whether an early break upward will occur or whether a reversal in the channel is at hand. A reversal could be a strong down move as the channel has a lot of room within it to fall now.
5/1 -- The channels have now given us the magic we needed to see that an interim top has formed and the short term picture is down. I've removed most of the older minichannels so we can focus on the bigger picture as it has been months since we've been in this position. The volatility might be confusing everyone else, but for us channelists, it was just what we needed -- a quick succession of lower highs and lower lows from which to see the new downchannels. They are well defined in the Dow, QQQQ, RUT and SPX as well as several sectors.
The top was formed in a somewhat classic 'W' type fashion with initial dips being bought, but leading to lower highs. The slope of the short term downchannels is similar to the slope of the prior upchannel as well, and the stochastics have been pointing down. Long term charts are not yet in jeopardy, but a few sectors will be soon.

Thomas Shadburn Shanky's Charts and his Shankystechblog shows support levels crossed with Fib retracements although technicals are oversold and suggest some bounce soon.

Finally, Joe takes us through the week:

Weekly Dow shown pinned to 61.8% retracement

While weekly Summation Index gently rollsover = bearish for Nasdaq over the next 3 weeks to 3 months.

So while futures indicate a weak start for Tuesday there are conditions for the rally to continue for a little while longer. Can Tuesday close with a flourish?
Follow Me on Twitter
Build a Trading Strategy in Zignals; Read how and earn real money (once out of Beta) in this PDF.
Dr. Declan Fallon, Senior Market Technician for Zignals.com, offers a range of stock trading strategies for global markets, also available through the latest rich internet application for finance, the Zignals MarketPortal or the Zignals Trading Strategy MarketPlace.
Zignals offers a full suite of financial services including price and fundamental stock alerts, stock charts for Indian, Australian, Frankfurt, Euronext, UK, Ireland and Canadian stocks, tabbed stock list watchlists, multi-currency portfolio manager, active stock screener with fundamental trading strategy support and trading system builder. Forex, precious metal and energy commodities too. Build your own trading system and sell your trading strategy in our MarketPlace to earn real cash.
Read what others are saying about Zignals on Investimonials.com.
JOIN US TODAY - IT'S FREE!


