Market closed the week with yet another flourish; how much more can it offer new buyers?
Anthony Caldaro of
ObjectiveElliotWave has an S&P 60-min target of 1,222 as part of a fifth wave of five from February's low.

Yong Pan of Cobrasmarketview shows a more diverse mix of signals on the Intermediate time frame but a firm neutral on the short term.
Option Calls at extremes
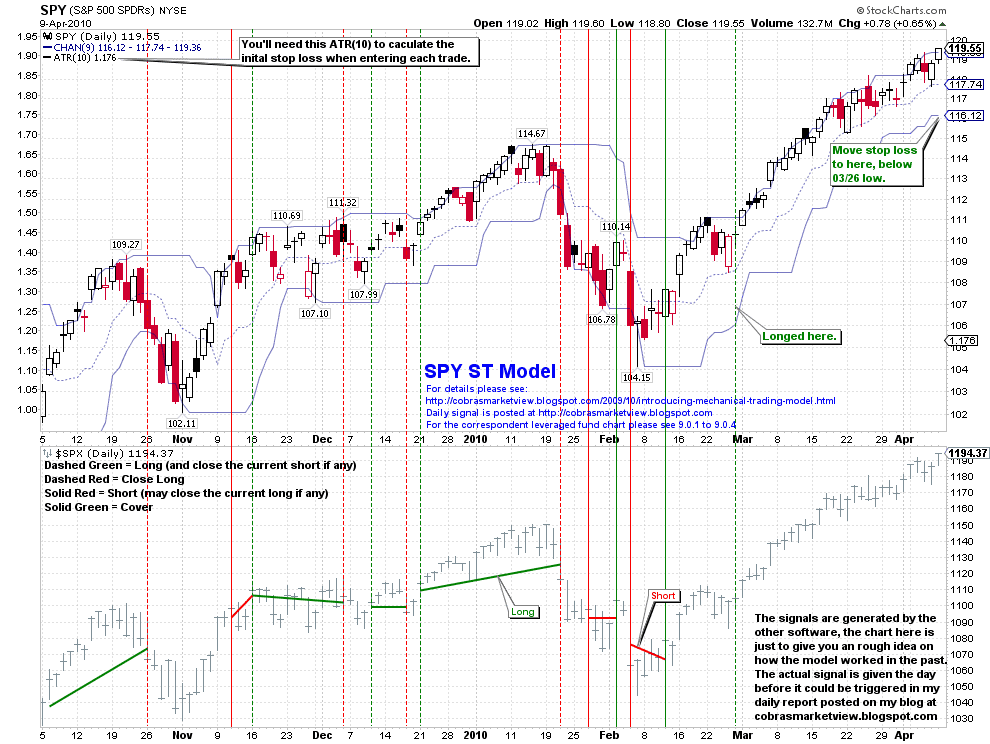
Yong's automated model is trailing the stop on channel bands. Nice profit so far.
Richard Lehman of TrendChannelMagic.com says it best in his opening paragraph (my epmphasis):
4/11 -- Dow 11,000 pulled things up like a magnet at the end of the day Friday and the trend simply continues. Many of the short term greens have changed slope, but continue upward. Whatever is holding this market up is not something you want to fight with, and whether it makes sense either fundamentally or technically is irrelevant.
4/8 -- More bounces and more line hits, but no new breaks. Long term charts still very toppy, but short terms just changing slope and still heading northward. The Dow bounced twice precisely off its lower blue minichannel before bouncing.
4/7 -- Thanks to public unrest in a country I can't even spell and yet another flip-flop on the Grecian empire's crisis, the market got a wee bit spooked today and gold shot up even further. But if you want to view this as the beginning of the great correction, you won't have a whole lot of evidence to back you up...yet. Little if any short term charts broke, except the Dow and SPX going sideways. And bouncing off lower channel lines is more bullish than bearish. So lighten up on equities, yes, but go heavily short yet -- not sanctioned by thecharts.
4/6 -- Well, someone just wake me up when the Dow hits 15,000 so I can put my shorts on again - ok? The channels just keep on setting records and changing slope, but the idea of breaking seems to go against physics. I just don't want to be long when whoever is propping this up walks away.
At least one major firm told its Reps top lighten up on stocks and put more money into resources & commodities. I think that will become a popular theme here as equities get beyond anyone's wildest imagination without a correction. That will send gold, oil and other resource ideas soaring. And when people begin lightening up on bonds that could further the trend. The money has to go somewhere. Get on that wave and ride it.
For Michael Eckert of EWTrendsandcharts he is watching the tightening corrective wedge.
Joe Reed sums up the week:
What is the banking index saying about GS and BAC? Will they be breaking Oct 2009 resistance?
Nasdaq Summation Index 'Sell' trigger:
Will the next bottom in the Gold and Silver Index be a good 'buy'? Sector performing well.
Finally, Robert New of TheInformedTrader has the Nasdaq tagging resistance.
So another week passes where the brave profit, but the attractiveness to buy remains low.
Follow Me on Twitter
Build a Trading Strategy in Zignals; Read how and earn real money (once out of Beta) in this PDF.
Dr. Declan Fallon, Senior Market Technician for Zignals.com, offers a range of stock trading strategies for global markets, also available through the latest rich internet application for finance, the Zignals MarketPortal or the Zignals Trading Strategy MarketPlace.
Zignals offers a full suite of financial services including price and fundamental stock alerts, stock charts for Indian, Australian, Frankfurt, Euronext, UK, Ireland and Canadian stocks, tabbed stock list watchlists, multi-currency portfolio manager, active stock screener with fundamental trading strategy support and trading system builder. Forex, precious metal and energy commodities too. Build your own trading system and sell your trading strategy in our MarketPlace to earn real cash. Read what others are saying about Zignals on Investimonials.com.
JOIN US TODAY - IT'S FREE!